LABCAT Certification Example 

RMAEC shares how to perform Lottman Method in the asphalt lab 

During this 30th anniversary year of the Rocky Mountain Asphalt Education Center (RMAEC), it’s fitting to celebrate the institution’s successes since its founding in 1996, and to share how members of the asphalt industry benefit from its hands-on training. The RMAEC is the sole administrator of the Laboratory Certified Asphalt Technician (LABCAT) program, which is required by the Colorado Department of Transportation (CDOT), and offers education and training in preparation for several levels of certification. 

Prospective technicians may attend the “Intro” classes at a very low cost to have a smaller, comprehensive classroom experience with lecture and hands-on in the laboratory before registering for a certification session. Greg Potts, an instructor since the start of the 2025 season, had been through the program every three years during his nearly 20-year career. Potts has been refreshing and updating the training materials to provide a brief and digestible (but detailed) reference summary of each test procedure in the program. 

The foundation for continued success has been a classroom lecture with real-time Q&A, an electronically administered exam, proctored laboratory proficiency demonstrations, and the critical review of the program by every person who comes through the classroom door. The proctors are LABCAT-certified industry professionals who volunteer intermittently to bring their expertise and fellowship into the laboratory, and they represent the community that is the Colorado Asphalt Pavement Association (CAPA). 
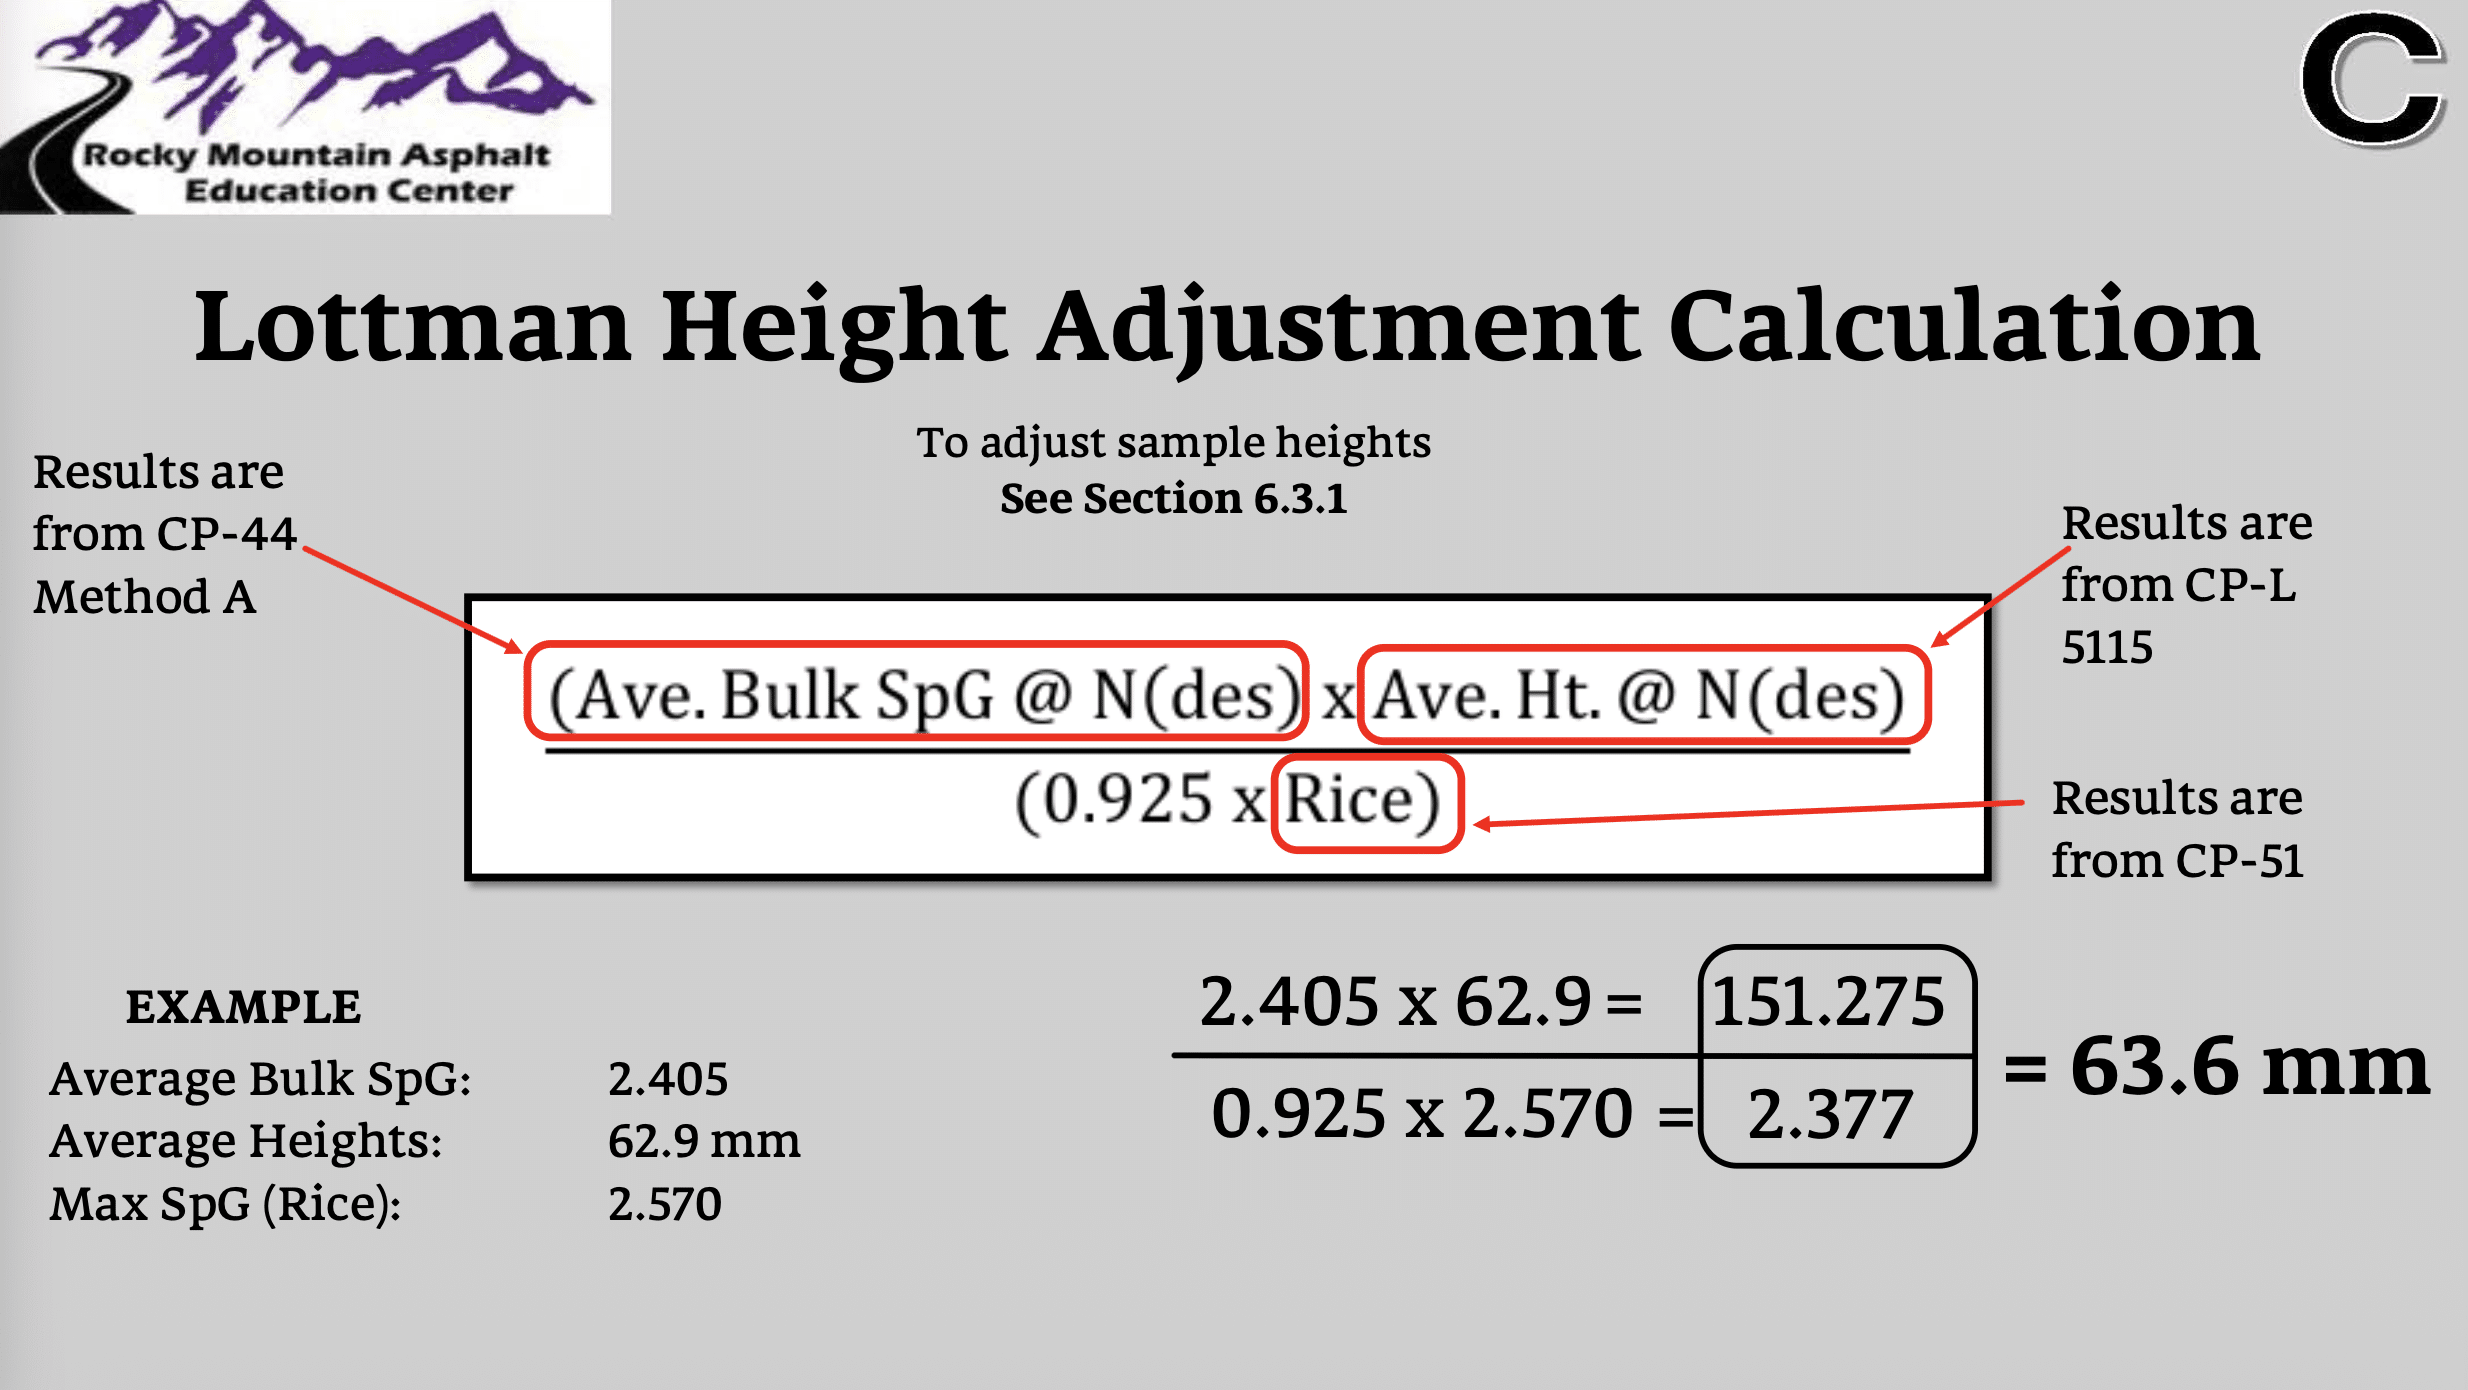
Illustrations courtesy of RMAEC

Illustrations courtesy of RMAEC | The RMAEC materials and instruction help the student who needs to adjust the height of the Lottman pucks.

During Level A, the students learn procedures for: 

  • Stratified Random Sampling of Materials
  • Sampling of Aggregates 
  • Sampling of Asphalt 
  • Bulk Specific Gravity of HMA Pavement Cores Method B and C 
  • Compaction Test Section 
  • In-Place Density by Nuclear Method

Increasing BMD Efficacy with Technology: Part 2

During Level B, the students learn procedures for: 

  • Verification of Laboratory Equipment 
  • Reducing Field Samples of HMA to Testing Size 
  • Bulk Specific Gravity of HMA Lab Compacted Specimen Method A 
  • Theoretical Maximum Specific Gravity of HMA (Rice) 
  • Asphalt Content by Ignition Method 
  • Determination of Moisture Content of Asphalt 
  • Asphalt Content by Nuclear Method 
  • Reducing Aggregate Samples to Testing Size 
  • -200 Wash and Sieve Analysis of Aggregate 

During Level C, the students learn procedures for: 

  • HMA Volumetric Properties, VMA 
  • Superpave Gyratory Compaction 
  • Hveem Stability 
  • Resistance to Moisture Induced Damage (Lottman) 

Rethinking Aggregate Performance for Long-Term Friction Safety After One Million Cycles

During Level E, the students learn procedures for: 

  • Sampling of Aggregates 
  • Reducing Aggregate Samples to Testing Size 
  • -200 Wash and Sieve Analysis 
  • Specific Gravity and Absorption of Fine Aggregate 
  • Specific Gravity and Absorption Of Coarse Aggregate 
  • Toughness (LA Abrasion) 
  • Micro-Deval 
  • Plastic Limit / Plasticity Index 
  • Soundness of Aggregate 
  • Clay Lumps and Friable Particles in Aggregate 
  • Sand Equivalent (Clay Content) 
  • Uncompacted Void Content of Fine Aggregate (FAA) 
  • Fractured Faces 
  • Flat and Elongated Particles 

Participants enrolled in LABCAT Level C certification learn moisture damage testing by performing the Lottman Test. To give an example of the curriculum, let’s break that down here for interested lab techs. 
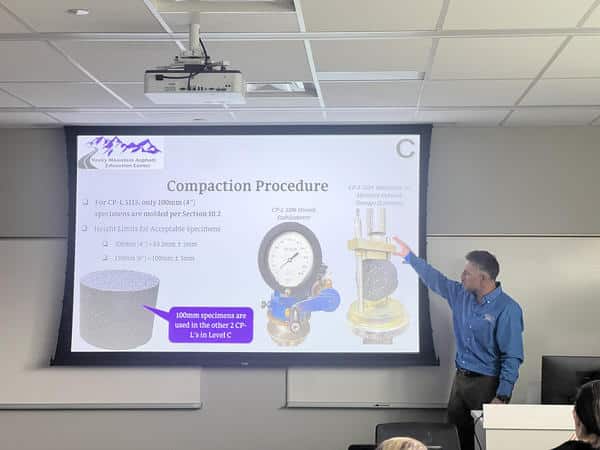
Greg Potts is an instructor at the RMAEC since the start of the 2025 season. He has been refreshing and updating the training materials to provide a brief and digestible reference summary of each test procedure in the program.

How to Perform Lottman 

Set up 

Testing the resistance of compacted bituminous mixture to moisture induced damage, also referenced as Lottman, is designated CP-L 5109 in Colorado. Your state will have a different designation for it, but the scope might be very similar. The point of the test is to predict a pavement’s long-term stripping susceptibility and to evaluate anti-stripping additives. In “lab speak,” the method covers the preparation of specimens and measurements of diametral tensile strength, resulting from the effects of saturation and accelerated water conditioning (freezing) of compacted bituminous mixes in the lab. 

To perform this method, RMAEC lists the following equipment will be needed: 

  • Superpave Gyratory Compactor 
  • Vacuum pump 
  • Manometer 
  • Scale 
  • Vacuum container 
  • A water bath set to 77°F 
  • A water bath set to 140°F 
  • A freezer 
  • Bags, plastic wrap and tape 
  • Loading strips 
  • Vertical press testing machine 

Balance Your Mix Design for Asphalt

Compact Your Samples to 7% 

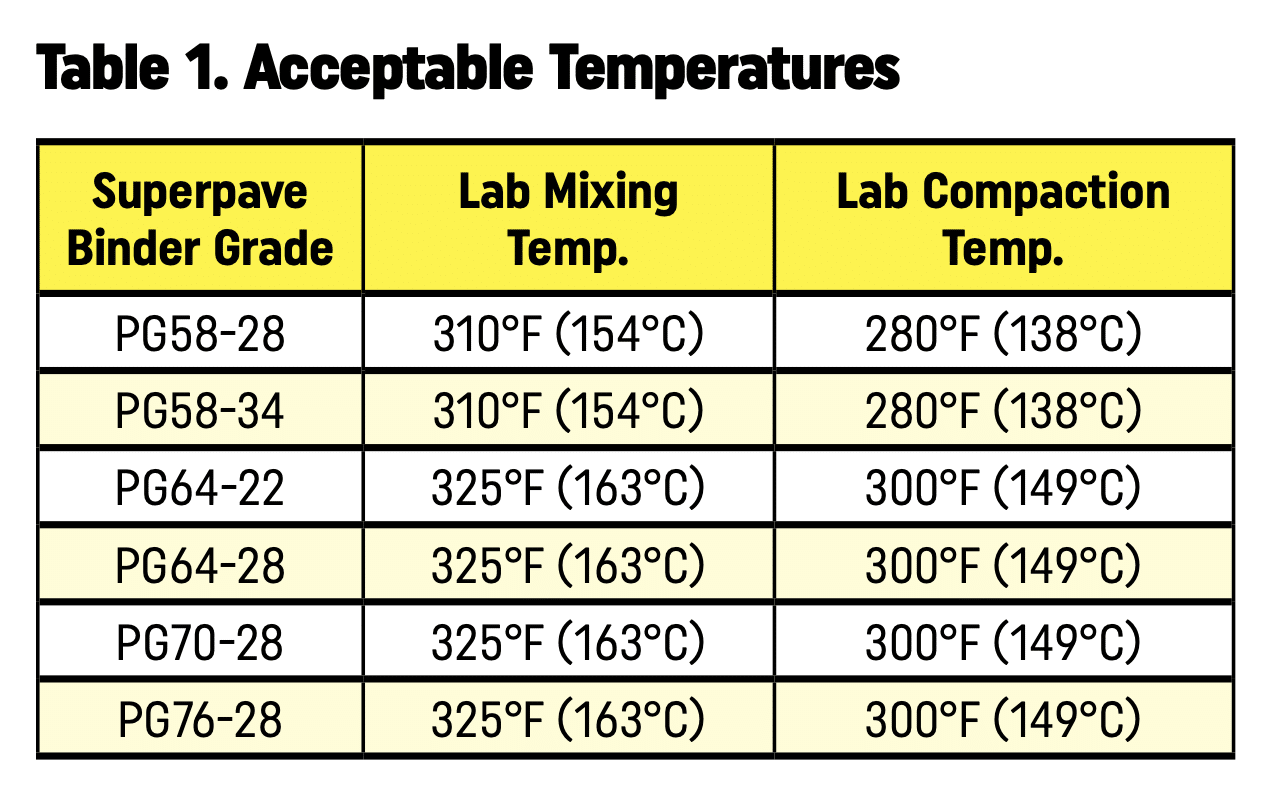
The samples must be at compaction temperature for a minimum of 15 minutes, but not more than 4 hours. (See Table 1.) To begin, you want to compact six volumetric samples (pucks) to target 7.0% ± 1.0% air voids, using either adjusted sample heights or adjusted sample weights. After the pucks have cooled to room temperature, perform a bulk specific gravity (GMB) on each and calculate air voids. 

Sort the specimens into two subsets of three specimens so that the average air voids of the two subsets are approximately equal. You are separating them into a wet (treated) subset and a dry (untreated) subset. 

For the dry subset, store the three pucks at 77°F ±1°F (25°C ±0.5°C) for several days during treatment of the wet subset. They must be brought to testing temperature of 77°F ±1.0°F (25°C ±0.5°C) for 3.5 ±0.5 hours at the same time as the wet subset before breaking. 
Treat the wet subset 

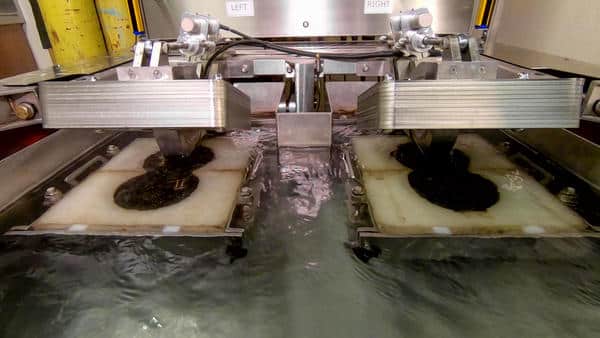
For the wet subset, you will begin treating these pucks by saturating them in the vacuum container. 

1. Place the pucks in the vacuum container with at least 1 inch of room temperature water above the top of the specimens. The specimens must either be rested on their side or elevated with some type of spacer beneath them. 

2. Apply 28 ±2mm of Mercury for a period of 5 ±0.25 minutes. 

3. Release the vacuum slowly and remove the specimens after “greater than 5 seconds.” 

4. Run CP-44 Method A immediately after removing the specimens from the vacuum container. 

5. Record “B Saturated” and “C Saturated” values. 

6. Submerge the specimens under the water for one second to ensure they are dripping wet again after the SSD condition. 

7. Wrap them tightly with the plastic wrap and tape, and place them into a labeled plastic bag. 

8. Place the bag of saturated, wrapped specimens into the freezer for a minimum of 16 hours. The freezer should be set at -2.5°F ±7.5°F (-19°C ±4°C). 

9. After 16 hours, remove the sample bag from the freezer and remove the specimens and the plastic wrap and tape. 

10. Place the specimens in the 140°F ±1°F (60°C ±0.5°C) water bath for 24 ±1 hours. 

11. After 24 hours, remove the specimens from the 140°F water bath and place them into the 77°F ±1°F (25°C ±0.5°C) water bath for 3.5 ±0.5 hours. Note that the water temperature of this final bath will increase with the introduction of the “hot” specimens. No more than 15 minutes can pass before the temperature is returned to 77°F. If necessary, you may add ice cubes to counter the rising temperature. 

Test 

After the 3.5 hours in the 77°F bath, it’s time to test all the specimens. Remove each dry specimen, one at a time, from the 77°F incubator and each wet specimen, one at a time, from the 77°F water bath and place each between the loading strips and into the vertical press testing machine. The rate of loading is 0.2 inches per minute. Record the maximum compressive strength (the peak or max load). Keep in mind, the two subsets of three specimens should be tested within 30 minutes. 

How to Use BMD with Airfield Mixes

Run your calculations 

With all six specimens tested, it’s time to run the calculations. Figuring the tensile strength ratio requires you to input the following information: 

St = tensile strength, psi 

P = maximum load, pounds 

t = specimen thickness (height), inches (to 0.01 of an inch) 

D = specimen diameter, 3.937 inches for 100-mm molds or 5.906 inches for 150-mm molds  

There is a standard for reporting your results. For example, when you report your calculations, list the average percent air voids for each subset to the nearest 0.1%. The dry average tensile strength (S1), wet average tensile strength (S2) and percent tensile strength ratio (TSR) are listed as whole numbers. 

This is only one of the many tests and methodologies taught at the RMAEC for PC/OA and other certifications. Visit co-asphalt.com and explore the LABCAT and RMAEC tabs for more information or to register. 
Automate the Asphalt Lab

From sampling to data reporting and every test in between, automating various processes in the asphalt QC/QA chain offers consistency and safety along the way

In and around the asphalt testing lab, there are repetitive tasks that can be relegated to a machine, thus freeing the human technician for other tasks in the quality control/quality assurance (QC/QA) and testing sphere.

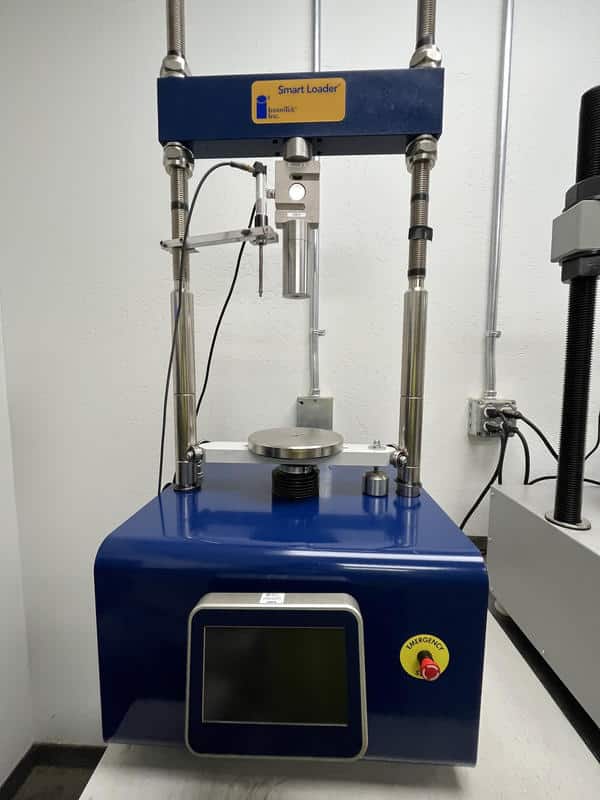
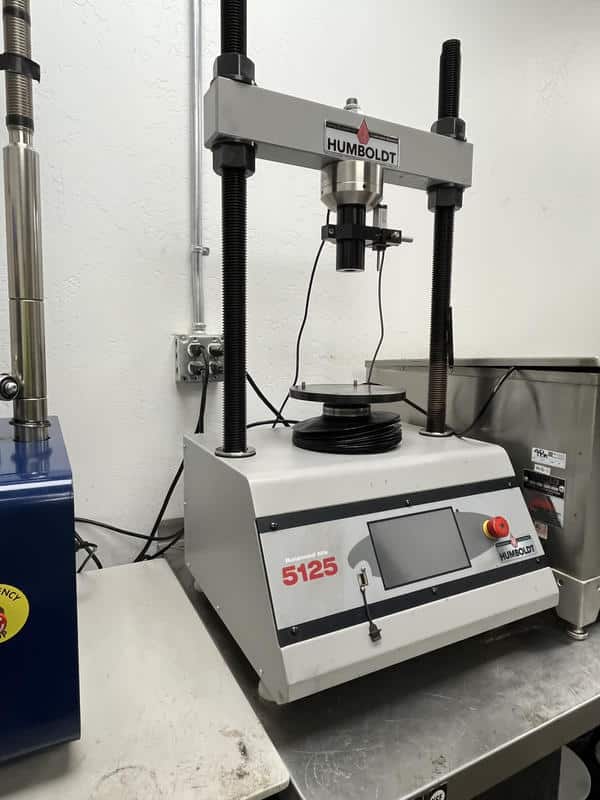
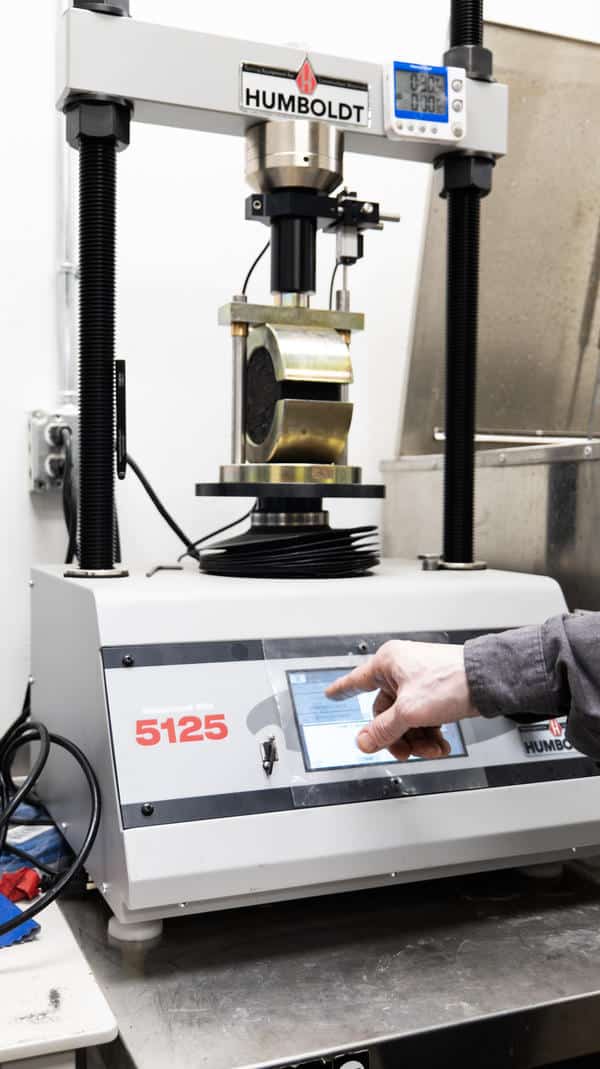
Solterra Materials uses InstroTek and Humboldt loading frames to support balanced mix design (BMD) testing for the accurate evaluation of mixes. Both photos courtesy of Solterra Materials

Automated Sampling Example

One of the automated QC/QA procedures that original equipment manufacturers (OEMs) have offered for decades is that of collecting hot-mix asphalt (HMA) samples from the truck bed in a safe and controlled manner. This process could involve a laborer climbing onto scaffolding, plunging a shovel into the back of a truck to get a few scoops of mix that he hopes represent the whole load. He then takes the bucket to the lab to be split and tested, etc. Or this procedure could be made more consistent and safer.

For example, Pavement Technology Inc., Covington, Georgia, includes its remote truck sampling device (RTSD) within its automatic quality control system. This setup, to be erected immediately beyond the loadout area at the plant, sinks a mechanical arm into the fresh load of mix to safely capture a representative sample from the haul vehicle. The arm then retracts and travels along a rail to deposit the mix through a chute to a waiting field ignition oven, where the sample is weighed, burned and re-weighed. A test report produces the asphalt content of the sample. The burned sample is deposited into the field gradation unit, which performs a complete sieve analysis of the sample. All test data is displayed on an excel spread sheet and sent to the asphalt plant’s control house without anyone having to shovel mix, split samples or remove pans from the ignition oven.

Of course, truck sampling devices don’t have to be that complex. In today’s changing environment, QC/QA personnel can select how much automation they desire and how much “hands-on” work they maintain control of from sampling to testing to reporting. Here’s how some of your peers are removing variability and introducing efficiencies in, and around, the lab setting.

Solterra Materials uses InstroTek and Humboldt loading frames to support balanced mix design (BMD) testing for the accurate evaluation of mixes. Both photos courtesy of Solterra Materials

Taking Automation Into the Lab

In a July 9 blog post for Humboldt Manufacturing, Zameer Syed wrote, “Laboratory technicians bring experience and judgement [sic] that no machine can replace. But many of the tasks they carry out every day are repetitive by nature. Handling specimens, recording measurements, moving samples between stations, and repeating the same process over and over again all take time. They also introduce opportunities for small variations between operators. If those repetitive tasks can be carried out automatically and consistently, technicians can spend more time where their expertise really adds value.”

While the technicians use their expertise where it’s needed most, automation can be applied to more mundane and repetitive tasks. Tanya Nash, director of engineering for Asphalt Testing Solutions & Engineering (ATS), Jacksonville, Florida, spoke of how she’s seeing this in action around the country, but specifically in her state.

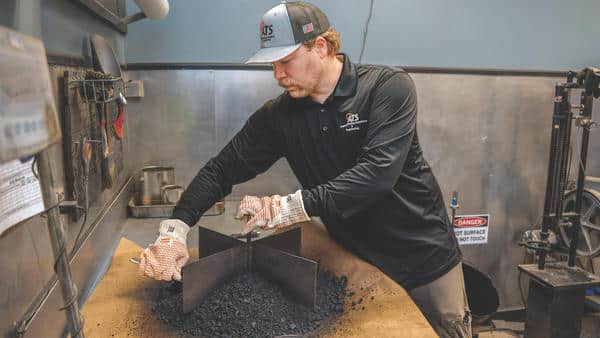
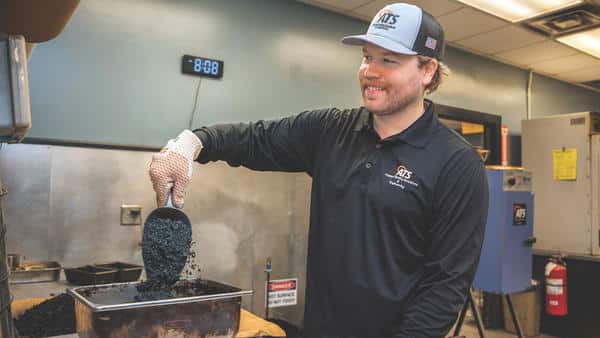
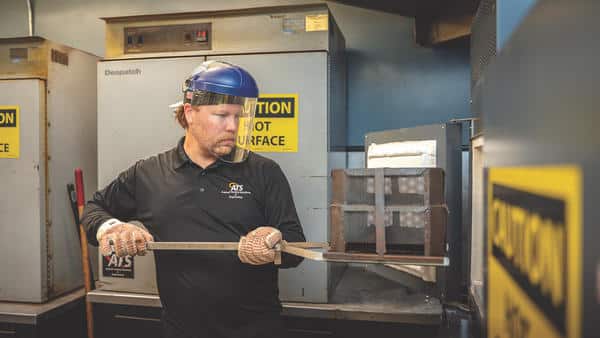
ATS Laboratory Specialist Tanner Nestle prepares asphalt samples for the oven. Photos courtesy of ATS

“Automation seems to be everywhere from the binder lab, to design, to QC, to mix performance,” she said, sharing that some of the technology is now being evaluated across the country for its impact on how technicians are trained and how expertise is being passed down. She listed these four areas where she sees automation already changing asphalt labs in the Southeast, particularly Florida:

  • Binder Lab: “On the production side (suppliers), the idea is turnaround. The use of automated equipment is high—flash point, penetration, specific gravity, and even some viscometers.”
  • QC Labs: “The use of automated truck samplers has been approved in Florida and being used by some contractors. The automated binder samplers used at the asphalt plants are in use. Although the automation of different volumetric tests are out there, I am not aware of anyone in Florida using the systems to date.”
  • Performance: “The same volumetric automation is used, more for research purposes—universities and proof of concept ideas. Systems are currently being built to look at other performance tests and sample fabrication devices to assist in reducing variability and technician time.”
  • Mix Design: “Artificial Intelligence and Machine Learning is in place, and some contractors are using it for their design processes and optimizations in Florida.”

ATS Laboratory Specialist Tanner Nestle prepares asphalt samples for the oven. Photos courtesy of ATS

No matter what part of the country you’re in, Syed noted in his blog, “As testing becomes more demanding, consistency becomes just as important as speed.”

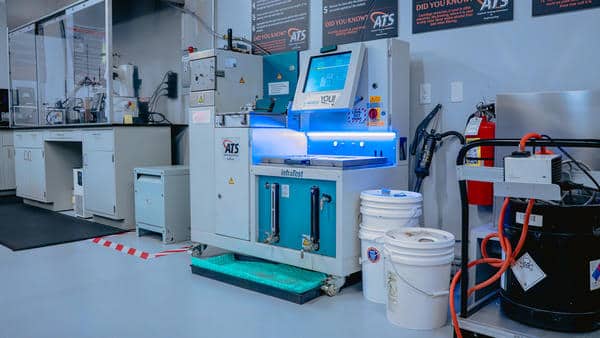
The consistency and speed that Syed wrote of were on the mind of Sathish Banda, P.E., the technical services manager for Solterra Materials, Phoenix, Arizona. “Solterra Materials uses infraTest automatic analyzer to improve the speed, accuracy and consistency of binder extraction testing,” Banda shared. “Automation reduces manual handling, minimizes operator variability and improves safety. This allows laboratory staff to perform other tasks while the analyzer is performing binder extraction.”

ATS Laboratory Specialist Tanner Nestle prepares asphalt samples for the oven. Photos courtesy of ATS

The technicians at ATS also incorporate automation during extractions. Nash shared: “ATS uses automation during their binder extractions—where it is not fully automated, some of the process is. This step is primarily for safety (solvent exposure), productivity, and for repeatability. We don’t have many ‘outside the normal’ automations when dealing with our mixtures. For example, the ignition oven; our ovens all have internal scales with automatic printout systems, which is an automation, just one the industry is so acclimated to. One automation that removes the human error is our DSRs. The programing on the instruments allows little room for error during setup and helps ensure the samples are performed the same every time.”

Banda shared that Solterra Materials also uses InstroTek and Humboldt loading frames to support balanced mix design (BMD) testing for the accurate evaluation of mixes. “Fully automated loading sequences and data collection minimize human error and allow technicians to process more samples and focus on data analysis.”

“ATS is always looking at different automated systems to improve efficiency,” Nash shared. “The key is making sure it is as good as the real thing.”

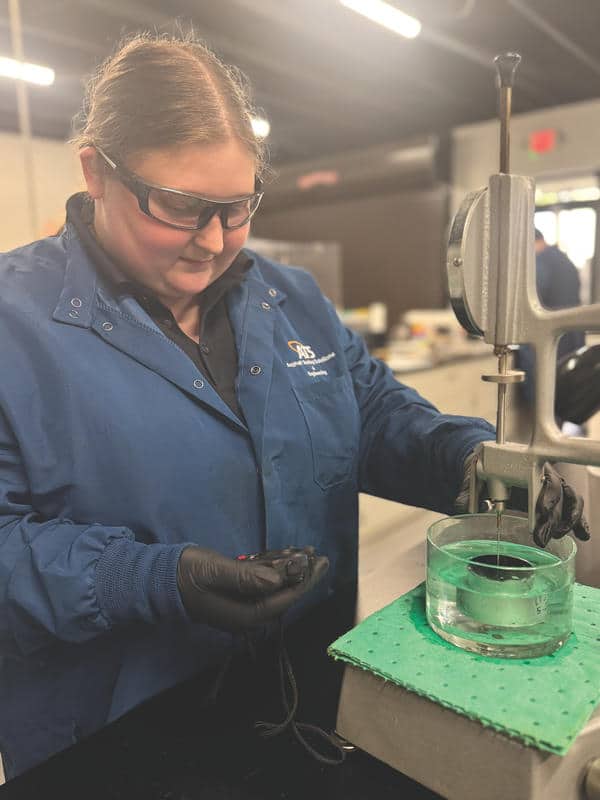
ATS Asphalt Binder Technician Rebecca Kohl measures the hardness of the asphalt binder during the penetration test. Photo courtesy of ATS

Keep People in the Loop

“Whenever people hear the word ‘automation,’ the assumption is often that it’s about replacing people,” Syed wrote. “I don’t see it that way.”

The people in the lab are integral to its success.

Austin Futrell, P.E., of Prairie Contractors LLC, Opelousas, Louisiana, shared that each of the company’s plants has its own lab with a semi-permanent lab technician. “However, we do have to move around quite often due to night work, multiple projects going on simultaneously, vacations/sickness, or other reasons.” To share files, they use Dropbox. “It connects all of our testing, designing, aggregate properties, and other documents so that each technician has access to every plant. It makes it easy to swap technicians if needed.”

In the Solterra Materials lab, fully automated loading sequences and data collection allow technicians to process more samples and focus on data analysis. Photo courtesy of Solterra Materials

The idea of communication and file sharing is integral to successful automation. This is the cornerstone of the connected work site.

While the Prairie Contractors’ labs don’t use automation “fully,” according to Futrell, they “have a long list of history with our materials that makes it easier for designing and comparing trends.” Futrell has already created multiple spreadsheets for designing and computing results and stated that the highly experienced team is comfortable with the system.

When it comes to that kind of communication and file sharing, whether your team participates in round robin testing out of a central lab you share with multiple contractors or you have a dedicated lab at each of multiple plants, you’ll be sharing data and test results with multiple entities. That data requires reliable transfer.

“Solterra Materials uses R18LabQMS to streamline its asphalt laboratory operations by centralizing quality records, automating calibration and maintenance reminders, and simplifying AASHTO R18 compliance,” Banda shared. “The platform reduces paperwork and keeps teams audit-ready with organized digital documentation. This allows laboratory staff to spend more time ensuring quality and less time managing administrative tasks.”

R18LabQMS isn’t the only system Solterra Materials has in place for digital documentation. The team also uses Stonemont Solutions Software to streamline asphalt QC by managing mix designs, test results and production data in a centralized system. “It provides real-time tracking of quality control results, simplifies reporting and helps to ensure compliance with agency specifications,” Banda shared. “By giving laboratory and production teams quick access to data, Stonemont supports QC personnel to make more informed operational decisions.”

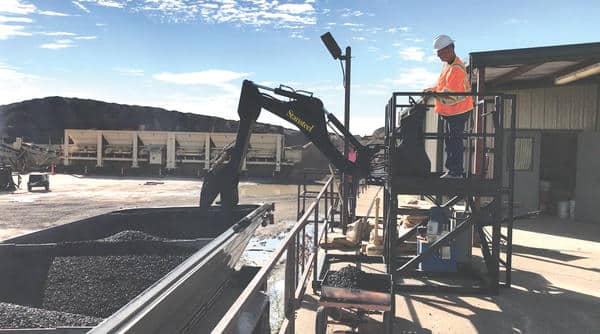
One of the truck sampling devices on the market is the Safe-T Sampler from Stansteel Hotmix Parts & Service, Louisville, Kentucky. This structure is to be erected immediately beyond the silo loadout. When a haul truck pulls alongside the device, an operator stands on the anti-skid tread-plate platform where he has a clear view of the material in the back of the truck, the hydraulic sampling arm, and the receiving splitter chute to the side of the structure, which uses the 180-degree motion capability of the Safe-T Sampler. The operator uses joystick controls to move the hydraulic sampling arm into the material and collects a 20-pound sample. He then uses the joystick to hydraulically move the jaw containing the sample to the splitter chute where the sample can be safely retrieved.

“When the automation is done correctly, the efficiency it can introduce can be high,” Nash said. “It frees up time in which technicians can be performing other tasks or analysis that does not have to be done by manually moving data around. Some of the efficiencies come from product use (our solvent extraction mentioned above), where we do not use as much consumable product as we would with a manual process. Other automation is about the workers’ safety. It prevents downtime from injuries or other issues.”

While sources have stated clear benefits to automating processes for efficiency, quality consciousness or safety, Nash offered a smart caution.

“Automation can be an asset but can also be a crutch,” she shared. “As long as you have the checks and balances in place to verify the automation and what kind of data it is producing, there should be no hesitation to use it. There should always be a basic understanding of the task that is being automated to know when there are issues to be addressed or problems with the system.”

The foundational knowledge she speaks of is one of the many core values humans bring to the table. And one of the many reasons industry professionals from laborers to operators to lab techs to inspectors can rest assured automation is a tool to assist, not to replace, employees in the workforce, making them and their work more consistent and safer.

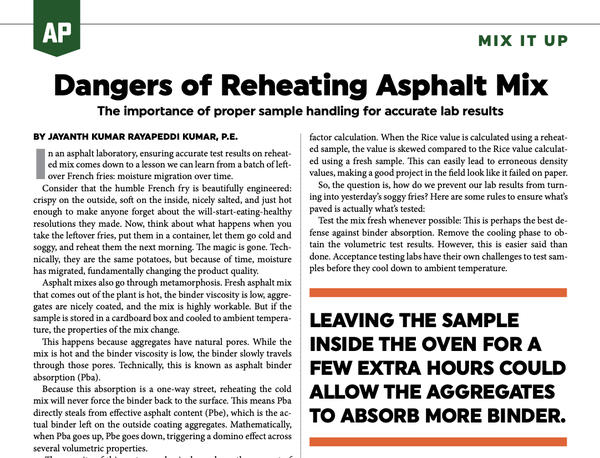
Dangers of Reheating Asphalt Mix

Reheating asphalt mix influences moisture levels in aggregate over time

In an asphalt laboratory, ensuring accurate test results on reheated mix comes down to a lesson we can learn from a batch of leftover French fries: moisture migration over time.

Consider that the humble French fry is beautifully engineered: crispy on the outside, soft on the inside, nicely salted, and just hot enough to make anyone forget about the will-start-eating-healthy resolutions they made. Now, think about what happens when you take the leftover fries, put them in a container, let them go cold and soggy, and reheat them the next morning. The magic is gone. Technically, they are the same potatoes, but because of time, moisture has migrated, fundamentally changing the product quality.

Asphalt mixes also go through metamorphosis. Fresh asphalt mix that comes out of the plant is hot, the binder viscosity is low, aggregates are nicely coated, and the mix is highly workable. But if the sample is stored in a cardboard box and cooled to ambient temperature, the properties of the mix change.

Leaving the sample inside the oven for a few extra hours could allow the aggregates to absorb more binder.

This happens because aggregates have natural pores. While the mix is hot and the binder viscosity is low, the binder slowly travels through those pores. Technically, this is known as asphalt binder absorption (Pba).

Because this absorption is a one-way street, reheating the cold mix will never force the binder back to the surface. This means Pba directly steals from effective asphalt content (Pbe), which is the actual binder left on the outside coating aggregates. Mathematically, when Pba goes up, Pbe goes down, triggering a domino effect across several volumetric properties.

The severity of this metamorphosis depends on the percent of asphalt binder absorption, which depends on the aggregate type used in the mix. A low-absorption aggregate like granite isn’t as “thirsty” as a high-absorption aggregate like the volcanic basalt used in Hawaii.

How to Use BMD with Airfield Mixes

Reheating a sample that uses low-absorptive aggregates might only cause a minor nudge in the test results. On the other hand, reheating a sample with high-absorptive aggregates can be the difference between the mix passing or failing. To make matters worse, the number of times a sample is allowed to cool to ambient temperature and reheated to test temperature only compounds the problem.

This means two different labs could test the exact same split-sample of a mix produced using highly absorptive aggregates and get wildly different results, simply because one lab let the sample cool down completely and reheated the sample prior to testing.

Because the reheated sample has absorbed some of the binder, lowering the effective asphalt content, the mix is harsher to compact, leaving extra pockets of empty space known as air voids. To make matters worse, the reheating cycle also affects the maximum specific gravity, also known as the Rice value.

This is exactly where reheating of mixes strikes a project where it hurts. Typically, cores drilled from the project are compared against the Rice value to compute the percent density, which feeds the pay factor calculation. When the Rice value is calculated using a reheated sample, the value is skewed compared to the Rice value calculated using a fresh sample. This can easily lead to erroneous density values, making a good project in the field look like it failed on paper.

Future of Petroleum Asphalt Binder Supply

So, the question is, how do we prevent our lab results from turning into yesterday’s soggy fries? Here are some rules to ensure what’s paved is actually what’s tested:

Test the mix fresh whenever possible: This is perhaps the best defense against binder absorption. Remove the cooling phase to obtain the volumetric test results. However, this is easier said than done. Acceptance testing labs have their own challenges to test samples before they cool down to ambient temperature.

Establish a correlation factor: If you know samples will be cooled and reheated for independent testing, establishing a correlation factor early in the project to account for the data shift is a good idea.

Watch the clock: When a sample goes into the oven for reheating, it is critical to ensure the sample doesn’t stay inside the oven longer than it needs to after reaching testing temperature. Leaving the sample inside the oven for a few extra hours could allow the aggregates to absorb more binder.

Avoid multiple reheatings: To avoid compounding the problem, it’s best to avoid putting a sample through the vicious cycle of reheating-cooling-reheating.

At the end of the day, it’s important to make sure the lab results reflect the true quality of the pavement on the road. After all, nobody wins when a perfectly good paving job gets penalized over how the sample was handled. Just like nobody wants to be served yesterday’s soggy fries.

Jayanth Kumar Rayapeddi Kumar is a quality control engineer at Jas. W. Glover Ltd. in Hawaii and a licensed professional engineer in the state of Hawaii. He has over 14 years of experience in the asphalt industry and is an active member of ASTM Committees D04 (Road and Paving Materials) and E36 (Accreditation and Certification).

How to Use BMD with Airfield Mixes

How to use BMD with airfield asphalt technology

Rutting is an important performance consideration in the design and evaluation of airfield asphalt because even small amounts of deformation can affect drainage, smoothness and operational safety. While existing Federal Aviation Administration (FAA) specifications include rutting evaluations, a recent study completed by the Airport Asphalt Pavement Technology Program (AAPTP), a cooperative agreement effort between the FAA and the National Asphalt Pavement Association (NAPA), focused on developing performance-based rutting tests and criteria that reflect the combined effects of aircraft loading, temperature and field conditions. These enhanced tests support the balanced mix design (BMD) approach to optimize durability and performance in airfield asphalt pavements.

The findings of the AAPTP report support potential updates to FAA P‑401.

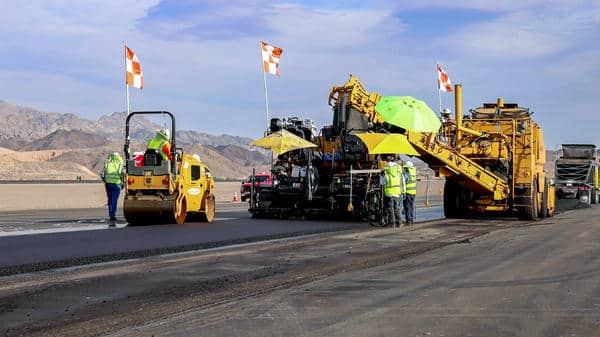
If you want to know how your asphalt mix will perform before it’s on the runway, using BMD can enhance traditional methods of testing by using performance tests to confirm which mixes will withstand rutting and cracking from aircraft loading. Photo courtesy of National Asphalt Pavement Association

Building a Practical Rutting Test Framework

The AAPTP study evaluated both laboratory- and plant-produced asphalt mixes from active airfield projects across the United States. The team included the University of Nevada, Reno (UNR), Rutgers University, the Texas A&M Transportation Institute, RDM International and Duval Engineering. Mixes represented a wide range of binder grades, aggregate properties, climatic regions and aircraft loading conditions.

Dr. Elie Hajj of UNR said the goal was to not only identify reliable rutting tests, but to determine how those tests could be implemented consistently throughout the project lifecycle.

“The aim was to move representative rutting mechanical tests beyond mix design and into verification and production to support a comprehensive BMD framework,” Hajj said.

The outcome is a framework agencies and contractors can use to standardize key test variables—such as air voids, temperature and specimen preparation—to improve consistency.

Balance Performance: BMD is not about maximizing one property at the expense of another. AAPTP paired the rutting study with a cracking study to support balanced performance across rutting, cracking and durability. That balance ultimately defines long-term pavement success.

Rethinking Aggregate Performance for Long-Term Friction Safety After One Million Cycles

Addressing Air Voids, Temperatures, 4 Tests

The study recommends running all rutting tests at 7% air voids (±0.5%). Traditionally, air void targets have varied by test method. For example, the Asphalt Pavement Analyzer (APA) is often run at design air voids, while the Hamburg Wheel-Track Test (HWTT) uses 7% per AASHTO procedures.

Evaluation of field density data from multiple airfields during the study supported the selection of a 7% target air-void level, as it captured a larger portion of the observed in-place air voids measurements. Importantly, the 7% target also enabled laboratory specimen preparation at practical heights, reducing the likelihood of aggregate damage associated with over‑compaction in the lab while remaining representative of densities measured in pavement mats and at longitudinal joints.

Why 7% Air Voids?

  • Consistent with observed in-place air voids.

  • Enables fabrication of specimens without inducing aggregate crushing.

  • Simplifies testing protocols across rutting test methods.

  • Eliminates confusion arising from different air-voids targets among test methods.

Current specifications typically require testing at 64°C for APA and 50°C for HWTT. Rather than testing all mixes at a single temperature, the framework selects test temperatures based on local climate using LTPPBind environmental PG values (50% reliability at the pavement surface, 12.5 mm rut depth). This results in temperatures typically ranging from 40°C to 64°C.

The study identified four rutting performance tests as reliable tools within a BMD framework, with calibrated criteria ensuring consistent mix design outcomes:

  • Asphalt Pavement Analyzer (APA)
  • Hamburg Wheel-Track Test (HWTT)
  • High-Temperature Indirect Tensile Test (HT-IDT)
  • Ideal Rutting Test (IDEAL-RT)

Together, these four tests provide agencies and contractors with a flexible toolkit that can be tailored to available equipment, project scale and the performance risk level of the airfield pavement area being paved.

Because HWTT combines rutting and moisture damage, the study recommends evaluating rut depth at 5,000 passes (instead of 20,000) to better isolate rutting behavior and improve correlation with other rutting tests.

Precise Specimen Prep: Specimen preparation had a measurable impact on results. Cutting or trimming specimens introduced variability, especially in HWTT under wet conditions. Using directly molded specimens will improve consistency across labs.

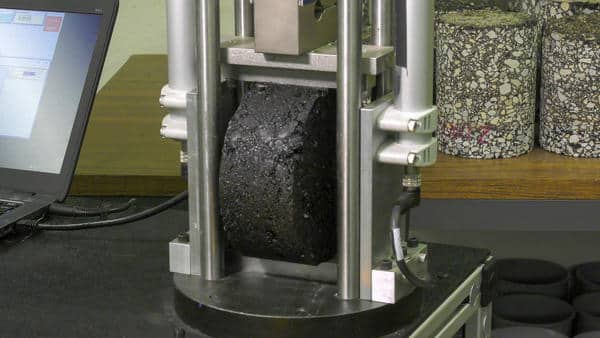
Monotonic tests, such as the IDEAL-RT shown here, help provide fast results with meaningful performance insight. Photo courtesy of the Federal Highway Administration

From Lab to Reality

To validate the criteria, pavement cores were collected from airfield sections with documented performance histories. Tests showed that mixes from sections with lower performance fell short of recommended criteria, while mixes from well-performing sections met them. This demonstrates that the framework can effectively identify mixes likely to deliver rut resistant, high-performing airfield pavements.

A multi-lab study showed most tests fall within about a 20% coefficient of variation. Monotonic tests showed less variability than repeated-load tests, and the project incorporated this variability into the established test criteria.

The study establishes rutting criteria tied to both climate and aircraft loading. Temperatures are climate-driven, while performance thresholds reflect aircraft weight and operational conditions. Although criteria vary by loading scenario, the recommendation is to design for the worst-case condition, which is slow or stationary loading.

Researchers also used mechanistic modeling (3D‑Move) to simulate aircraft stresses under realistic conditions, strengthening the link between lab results and field performance.

For contractors and agencies, the takeaway is that BMD provides a more reliable way to design asphalt mixes that perform in the field.

Navigating the EPA’s TCE Phase‑Out for Asphalt Labs

A Path to Implementation

The study outlines a phased approach to implementation, allowing contractors, labs and agencies to build confidence before full adoption.

Rutting performance testing can be incorporated into both mix design and verification processes. When the APA or HWTT is used for mix design, these tests can be paired with HT-IDT or IDEAL-RT for verification and acceptance. As agencies and producers gain experience with these methods, they can gradually introduce more reliance on HT-IDT and IDEAL-RT, allowing for higher testing frequency during production.

“The challenge with traditional rutting tests is that specimens have to be fabricated, conditioned and run over a long period of time,” said Adam Hand, PhD, of UNR. “You don’t want to keep paving for one or two days before getting an answer, so the index tests are going to be a good tool for getting an answer quickly or at least an indication of the anticipated performance.”

Asphalt Testing Solutions & Engineering Offers Asphalt Performance Testing and Mix Designs

Implications for FAA Specs

The findings support potential updates to FAA P‑401, including:

  • Multiple approved rutting test options;
  • Standardized air voids (7%);
  • Climate-based test temperatures;
  • Enhanced specimen preparation;
  • Integration into quality control and acceptance; and
  • Criteria tied to aircraft loading.

“BMD is a huge deal to bring to airfields,” Hand said. “The FAA specifications have not included these performance tests in the past, and with BMD, we’ll be able to assure better performance with a more reliable system.”

It’s important to note that the FAA already has rutting requirements in place: The AAPTP project was about advancing the science. The approach builds confidence in testing before full specification adoption and advances the readiness of BMD to support FAA and AAPTP goals for safer, more reliable and cost-efficient airfield pavements.

For contractors and agencies, the takeaway is that BMD provides a more reliable way to design asphalt mixes that perform in the field. Standardized air voids, climate-based temperatures, validated tests and consistent specimen preparation, combined with performance-based criteria, offer a practical path forward.

“Even when mixtures meet volumetric requirements, changes in binder source or formulation can affect performance,” Hajj said. “Communication between contractors, suppliers and agencies is critical.

“It will be important to monitor performance and continue refining as we learn more,” he added. “But this study gives us a strong foundation for moving forward.”

As airfield demands increase, that foundation will only become more important. “The Balanced Mix Design: Rutting Performance Tests” report is available from the AAPTP webpage. Visit airportasphalt.com to download the full report and supporting materials.

Brett Williams is senior director, Engineering & Technical Services, for the National Asphalt Pavement Association. He is the NAPA liaison for the Committee for Engineering Application and Practice and the Pavement Economics Committee Mixture Quality and Performance Task Force.


Solterra Materials Reflects Nationwide Asphalt Industry Trend

Solterra Materials, Phoenix, announced in March company growth, expanded operations across Arizona, and a new website. Recent statistics from P&S Intelligence have shown that the overall market size of the asphalt industry will expand to roughly $52.9 million by 2032. Solterra Materials, a leading Arizona-based asphalt materials provider and a division of Sunland Asphalt, is already seeing the effects of this expected growth.

Since its founding in 2018, Solterra Materials has expanded from 29 to 42 employees. This represents a nearly 45% increase for the company that operates across the state of Arizona, serving private, commercial, highway and infrastructure projects, and supports a wide range of asphalt needs, from private developments and commercial projects to large-scale highway and infrastructure work, as well as specialized asphalt solutions.

Along with promoting its team internally in 2026 and launching its new website (www.solterramaterials.com), a key component of Solterra Materials’ 2026 growth strategy is its enhanced quality control (QC) division, which features a fully accredited lab where the team can provide mix designs and QC services internally and for customers, giving additional confidence, project reliability and support.

“Across Arizona and nationwide, we’re seeing continued momentum in infrastructure investment, private development and roadway improvements,” said General Manager Scott Bollinger. “That growth is translating into increased demand for reliable, high-quality asphalt production and technical support. By expanding our team, strengthening our QA/QC capabilities and fully staffing our plant maintenance operations, we’re positioning Solterra Materials to meet that demand.”

Solterra Materials provided the mix for Sunland Asphalt to complete the high-profile APEX Motor Club expansion.

In addition to team growth, Solterra Materials has also strengthened their fully staffed, in-house maintenance team responsible for plant repairs, equipment optimization and infrastructure improvements. This investment has enhanced production efficiency, minimized downtime and allowed the company to maintain consistent, high-performance output.

The company has also expanded its industry footprint through participation in Building Women in Construction (BWIC), through the Arizona Chapter of the Associated General Contractors (AZAGC), demonstrating its commitment to workforce development and industry leadership.

Take a look over the next few pages at the products and services that will assist the entire industry this season as our industry grows. AsphaltPro Magazine is using the next few product gallery departments to highlight new technology launched at the recent CONEXPO-CON/AGG in case you missed anything you need to enhance your bottom line.

New EX 300 Plant Boosts Efficiency and RAP Capacity

New ALLU Bucket Reduces Hauling and Crushing Costs

Astec Digital Platform Connects Plant and Paving Data

CASE Adds AutoDig and Comfort Features to Loaders

New Cedarapids HSI Plant Targets High-Capacity Crushing

New TalonTrax Plant Targets Recycling Efficiency

EDGE Launches SCREENPRO S16 Screening Plant

EvoQuip Showcases Cobra 290R Impact Crusher

John Deere Introduces SmartDetect Assist for Safety

ProStack Names Sync Aggregate Utah Distributor

Vortex Burner Delivers Multi-Fuel, Low NOx Performance

Webster HDRA Burner Reduces NOx in Asphalt Dryers

Simplify the Search for Optimum Asphalt Content

Simplifying the search for Optimum Asphalt Content (OAC)

Author’s Note: This article presents a simple procedure that can be used to estimate optimum asphalt content. A more detailed version of this article, titled “Simple Analytical Procedure to Estimate Optimum Asphalt Content,” was originally published in ASTM International’s Journal of Testing and Evaluation, Vol 53, No. 2, 2025.

Asphalt producers allocate significant personnel and material resources to develop hundreds of hot-mix asphalt (HMA) mix designs annually. Traditional mix design methods such as the Marshall, Superpave and Hveem methods require multiple samples to establish the optimum asphalt content (OAC). For example, the Marshall method requires at least 17 samples to determine the optimum asphalt content. This includes two samples for measuring theoretical maximum specific gravity (Gmm) and three samples at five different asphalt content levels to understand how asphalt content affects air voids. The Superpave method requires at least 12 samples to estimate OAC.

Express Your RAP, RAS Content

Many state and federal highway agencies are strongly pursuing the implementation of balanced mix design (BMD), which requires fabrication and testing of substantially more samples to develop a compliant asphalt mix. Unlike traditional volumetric mix design methods, all of which have volumetric requirements such as limits on the voids in mineral aggregate (VMA), voids filled with asphalt (VFA), etc., at the design asphalt content for a preselected design air voids level, BMD introduces performance testing to evaluate cracking and rutting potential of mixes into the mix design process.

While some state agencies have opted to retain traditional volumetric requirements as a starting point for mix development, others have moved toward a more performance-focused approach that may reduce emphasis on volumetrics. Nonetheless, since developing a mix design using BMD or otherwise is a detailed, time-consuming process that demands significant effort, volumetrics most likely will continue to play an important role, either as a screening tool or a starting point for trial blends.

Current practice on mix design requires specific volumetric criteria to ensure performance and durability. Among these, one of the difficult challenges for mix designers is achieving the minimum required VMA. The Asphalt Institute’s MS-2 manual even points out that it’s not uncommon for designers to finish their laboratory mix design, only to find out that the VMA falls short of the requirement. To overcome this, designers tweak the aggregate proportions and asphalt content until the mix meets the VMA criteria.

But the challenge does not stop at the design stage. During production, VMA can collapse because of aggregate breakdown, usually by about 0.2% to 0.5%, according to the article “Fix Your Mix” published in Asphalt Institute’s Asphalt magazine in June 2016. To stay ahead of this problem, designers typically aim for a VMA slightly above the minimum, giving their mixes extra leeway for real-world conditions.

Current mix design methods are iterative, relying on trial and error to select the right aggregate structure and binder content to meet various volumetric criteria. It is like trying to navigate an unfamiliar city using a paper map by unfolding and refolding the map, squinting at tiny street names, taking wrong turns, and often backtracking to reach the destination. It takes patience and a lot of effort. Yet, just like switching from paper maps to a GPS makes navigation smoother and faster, a simple tool would be useful to take the hassle out of estimating OAC.

Balance Your Mix Design for Asphalt

Proposed Estimating Procedure

The proposed procedure is based on three well-established equations used in volumetric asphalt mix design and a newly developed equation based on these.

Using these three equations, an analytical expression shown in Equation 4 is derived to estimate the optimum asphalt content (P̂b). A detailed explanation of this equation is provided in the referenced ASTM paper.

Pa—Air voids (%)

Pb—Percent Binder Content by total weight of mix (%)

Gmb—Bulk Specific Gravity of compacted specimen

Gmm—Theoretical Maximum Specific Gravity of loose mix specimen

Gsb—Bulk Specific Gravity of combined aggregate blend

Gse—Effective Specific Gravity of aggregate

Gb—Bulk Specific Gravity of asphalt binder

VMA—Voids in Mineral Aggregate (%)

It is useful to note that, for fixed air voids (Pa), the estimated bulk specific gravity of a compacted sample (Gmb) decreases as asphalt content (Pb) increases in Equation 1. This occurs because the theoretical maximum specific gravity of the mix (Gmm) decreases with increasing asphalt content. Similarly, for a fixed VMA, the estimated Gmb increases as Pb increases in Equation 2. The intersection of these two curves represents the point at which the mix simultaneously satisfies the target Pa and VMA criteria. The corresponding Gmb at this point is referred to as the critical bulk specific gravity (Gmb−crit) and the corresponding Pb is the estimated OAC of the mix.

Based on Equations 3 and 4, only six inputs are required to estimate OAC. These inputs are:

  • Trial asphalt content, Pb (at which the loose mix for Gmm testing is prepared)
  • Gmm at trial asphalt content
  • Gb of the binder
  • Gsb of the combined aggregate blend
  • Target air voids, Pa
  • Target VMA for the mix

Compaction’s Role

There was no mention of compaction effort throughout this discussion, which raises an important question: Can we accurately estimate optimum asphalt content without factoring the compaction level? The Asphalt magazine article “A Look at Superpave5” from May 2019 addresses the issue of the effect of compaction level on Superpave mix design methodology by stating “A common myth is that laboratory compactive effort (Ndesign) will change asphalt content, but data does not support that.”

The Federal Highway Administration reinforces this in its December 2010 Tech Brief titled “Superpave Mix Design and Gyratory Compaction Levels” stating “there is a misconception that gyratory compaction level controls the voids and asphalt binder content of the mix. In truth, it is the gradation and aggregate properties and their resistance to compaction that controls the air voids and resulting binder content.” The Tech Brief also notes that, because of the need to stay competitive, asphalt producers modify their design aggregate structure within the design limits to make it possible to obtain a new aggregate skeleton such that a minimal amount of asphalt binder is used to achieve target air voids. It further points out that the air voids of a mix are controlled by VMA and not by compaction level. Other researchers have arrived at similar conclusions. While the above is true for the mix design process, it is also true that for given aggregate properties and a fixed gradation, as compaction level increases, the binder content must decrease and vice-versa to achieve the target air voids.

How AMIBIND Helps Crews Lower Temps Without Changing Plants

The premise of the procedure presented in this article is that the aggregate structure and compaction level have indeed a substantial effect on the resulting mix volumetrics. However, Equation 4 provides an estimated OAC achieved with some unspecified compaction level only for a trial aggregate blend. If volumetrics cannot be satisfied with that OAC at the selected “design” compaction level, then the designer will need to modify the aggregate structure. This is no different than with any other design method, but it is done with minimal testing. The procedure is particularly useful when working with new aggregates and blends. It offers a simple, analytical, and efficient starting point by estimating the likely optimal Pb based on the target Pa and VMA.

Based on this information, the designer can fabricate one set of specimens to check whether the mix meets all the target requirements. If it does, the mix is compliant. If not, the designer will know early on that adjustments to the aggregate structure are needed, without trial-and-error using multiple test batches. The single point verification ensures less waste of time, effort and materials.

From Equations to Application

With the six input values, a mix designer can quickly use Equations 3 and 4 to generate the estimated OAC for the blend. Once OAC is known, the designer can prepare two samples to determine Gmm, and compact two gyratory or three Marshall specimens to determine Gmb and calculate Pa and VMA. If the calculated volumetrics meet the target criteria, the job mix formula can be considered established. The same blend can then be tested at other asphalt contents to complete the mix design.

Evaluation of the Regressed Air Voids Approach for Mix Design

Confidence in the Procedure

The proposed procedure was validated using a combination of laboratory-prepared mixes, previously formulated designs from multiple asphalt producers, and long-term pavement performance (LTPP) data. More than 65 mix designs in total were evaluated.

Estimated OACs from the procedure were compared to the values from traditional mix design methods. The results demonstrated excellent agreement, with a correlation coefficient of 0.99. Full details of the validation process are provided in the ASTM paper.

Benefits of the Proposed Procedure

Optimum Asphalt Content: Solved Analytically

For any given aggregate blend, the OAC can be estimated analytically using Equation 4, requiring just six inputs, all of which are already part of traditional mix design methods. This equation is built on well-established volumetric equations that have long been the foundation of Marshall and Superpave mix design approaches.

A Quicker Route to Job Mix Formula

Unlike traditional mix design methods, which can require up to 17 and 10 samples using the Marshall and Superpave methods, respectively to establish the OAC, the proposed procedure significantly reduces laboratory effort. Assuming no alternative blends are being evaluated, OAC can be determined with four to five samples, which saves time and materials to establish the job mix formula.

Build the Test Section for Validation of Plant Produced Mixture

An Easier Way to Manage VMA

It’s not unusual for mix designers to reach the end of the mix design process and discover that the VMA criterion hasn’t been met. Also, it’s industry knowledge and experience that VMA can collapse during production. The proposed procedure offers a practical solution to both issues. It gives the mix designer the flexibility to input a target VMA that accounts for expected collapse during production. For instance, if the design VMA requirement for a mix is 15.0, but experience shows VMA typically drops by about 0.5% during production, the designer might enter 15.5 to estimate OAC. This proactive adjustment helps ensure the final mix meets targets not just during design but also in production.

Streamlining Testing for BMD

In the context of BMD, any approach that can simplify volumetric verification can be a valuable tool in a designer’s toolbox. In this regard, the proposed procedure may offer a way to ease some of the added workload that comes with BMD. By reducing the number of specimens needed to validate a selected aggregate blend, this method provides an opportunity to streamline the early stages of mix development.

Four Tips for Lab Sampling

Final Thoughts

Designing asphalt mixes to meet volumetric criteria can be simplified. The procedure presented in this article and detailed in the ASTM paper referenced earlier provides a more efficient, analytical approach to estimating OAC using fewer samples and familiar equations. We believe it offers a practical option that may help save time and resources, while simplifying the search for optimum asphalt content.

Request access to the longer, more technical paper titled “Simple Analytical Procedure to Estimate Optimum Asphalt Content” in Vol 53, Issue 2 of ASTM International’s Journal of Testing and Evaluation here: https://store.astm.org/jte20240242.html


Jayanth Kumar Rayapeddi Kumar, PE, ENV SP, currently serves as the quality control engineer for Jas. W. Glover Ltd. in Hawaii, and on the ASTM D04 committee on Road and Paving Materials and the ASTM E36 committee on Accreditation and Certification. Reach him at jayanthk@gloverltd.com.

Adrian Ricardo Archilla is a professor in the Department of Civil, Environmental, and Construction Engineering at the University of Hawaiʻi at Manoa, with more than 25 years of experience in asphalt materials characterization and pavement engineering research. Reach him at archilla@hawaii.edu.