Use What You Document at the Plant—Part 3
BY Ken Monlux
A Way Forward
This is part three in our discussion of plant reporting and documentation. Here, we will look at the steps needed to provide the log—which we discussed in depth in Part 2—to your plant sites. In Part 1, we discussed a method of collecting, evaluating and distilling data into a user-friendly matrix called the log.
Let’s suppose you are ready to either install or transition to a log-based platform. Let’s take a look at what’s involved.
You first want to choose which arrangement would work best for your company.
- A Log-based subscription service provided by an outside contractor typically provides all aspects of the platform.
- A fully designed log-based platform created by a contractor on behalf of the plant, then managed internally, requires the position of “log editor” be an in-house employee with access to outside training and support.
- A modified log-based platform using current in-house data collection and managed internally would have an outside contractor to manage the transition phase. As with Option Two, the position of log editor is filled by an in-house employee.
The position of log editor is significant to the success of the program. The editor must have deep knowledge of the hot mix process. They must have attention to detail and be diligent in their work effort. They require the ability to work with various platforms via the Internet and other methods of data collection. The right log editor will make or break the log.
Let’s look at the steps, which include holding a pre-setup meeting, executing a site visit, preparing the design, and preparing a mockup.
The pre-setup meeting
This meeting needs to be presented by the development team of the log-based platform to provide answers and direction to the project. There are two management levels that would benefit from this initial presentation—executive management and the local manager.
The executive managerial group will be provided with an overview of the process and framework of the steps needed to be installed at the plant site. The development team should use this meeting to establish a project timeline; get permission from the executive group to access various resources to establish the log; and request a “point of contact” from corporate that would be assigned as a liaison. The development team will give the local manager insight into the log, which can be part of the site visit.

The site visit
Before the site visit, it may be helpful to get a view of the plant site via Google Earth or drone footage. It’s amazing what you can discover by taking the time to study this photo. Such things as stockpile management, housekeeping and truck routes are just a few. Prior to arriving on site, the development team would have a general idea of the operation.
The site visit is paramount to the success of the program. It is part interview, part data collection and part plant site inspection. The site visit would be conducted over a single day, preferably during a production run.
The objective of the site visit would be to get a feel for the layout of the plant and the personality of the crew. The team would start to develop a relationship and line of communication with the local management. In addition, it would allow the local manager to better understand the roll of the log editor. Armed with a successful site visit, the development team walks away with the knowledge of the day-to-day flow:
Listen to the manager:
- How does he view the plant?
- What are his priorities?
- What changes would he make?
Inventory:
- Stockpiles of aggregates, RAP, and tank storage
- Flow of production process
- Silo storage: number and configuration
Typical times of operation:
- days per week
- hours per day and/or per night
Crew jobs description:
- Observe the interaction within the crew
- Response of the crew to such things as, hours of operation, breakdowns, and night work
- Interview of quality control tech. assigned to plant
- Interview with sales/service assigned to plant
Perform a Data inventory:
- List all forms of data generation at the site
- Start to formulate site-specific forms and vital signs
- Take note of current data recording, dashboards and other methods of documentation on site
Design
Map out the design of the log-based platform for this site.
Based on the site visit, a recap report is written. This recap is generated from notes, interviews and questionnaires collected during the site visit. This document is distributed to the local manager and point of contact for comment and corrections. Once corrections are made, the recap will become the foundation of the log.
At this point, the development team starts to:
- Design the plant report form
- Establish vital signs
- Contact utility company (in the case of smart meters)
- Work with the point of contact who can provide additional statistics such as QC reports, inventory control and summary of truck tags, etc.
The design phase goes on until all parties are satisfied and agree that the log will meet the needs of the plant. Once done, the team starts to look at the remainder of raw data sources in an effort to integrate with the log. This step is to develop the balance of the log’s narrative. Once reviewed and approved, a mock-up of the log will be produced. The purpose of the mock-up is twofold: It will be a training tool for the log editor and an education device for the local manager.
In an effort to be brief, we will only look at page one of the log in mock-up form. The other portions will be provided in summary only.
Mock-up
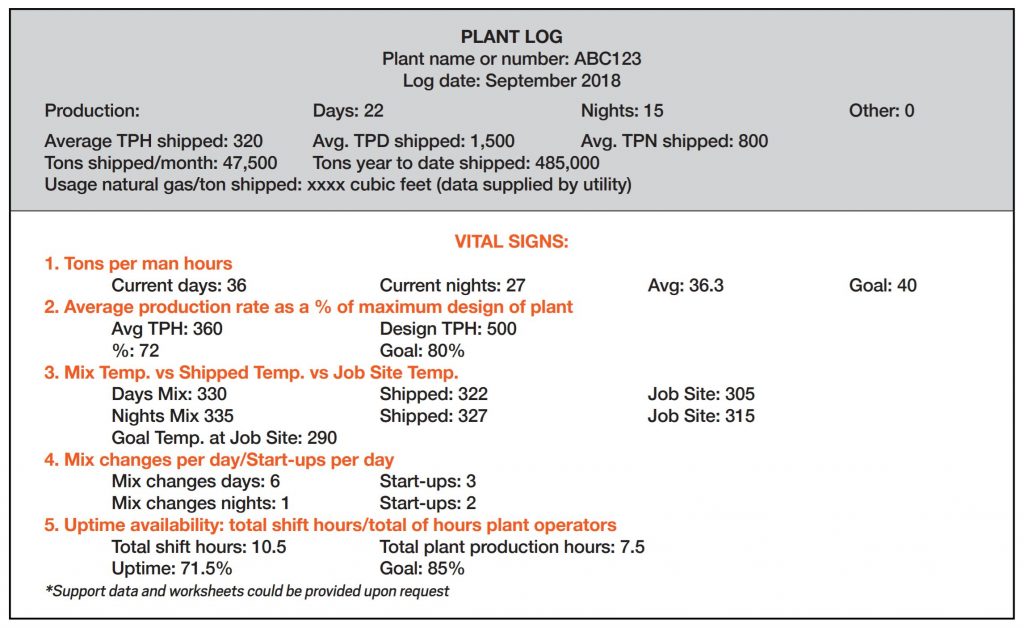
Let’s take a moment to examine the mock-up. By design, the mock-up provides a lot of information that can be absorbed quickly. The top of the page is laid out to give the manager summary information of the production. This information is formatted in such a way as to provide a framework of the outcomes of the vital signs. It establishes where the plant is at that point in time.
Moving down the page, we are directed to the vital signs. Set in no particular order, the vital signs indicate the health of the plant. It is interesting to remember that the vital signs do not find fault. Their function is to:
- make the data understandable;
- make the data relevant; and
- challenge the manager.
Of the three, the challenge may need a little more discussion. By identifying areas where a goal is not met, the manager can start to look for ways to improve. For example: Looking at the mix temperature, the manager could work with the plant operator in an attempt to get closer to the desired job site mix temperature goal.
From time to time, the log editor may elect to exchange a satisfied vital sign for a new and different sign. In this way, the log continues to challenge the local manager.
The balance of the log platform can be easily summarized by sections and appendices as follows:
- Narrative overview from the plant performance
- Recap of conversations between the log editor and the manager
- Day-to-day summary of weather
- Appendix I: Daily Shift Plant Report, which is an electronic copy of the plant reports/date
- Appendix II: Inventory
- Appendix III: List of in-house or outside major projects supplied
- Appendix IV: QC spreadsheet, based on data supplied by in-house QC dept
The log-based platform, as delivered to the local manager, makes good in its commitment to provide a simple to read, easy to understand document. The log also works well as an archive testimony of the operational performance. Once digested, it can be filed and retrieved as needed.
We performed our site visit, developed site-specific forms and spreadsheets integrating various platforms and reports. We then produced a mock-up of what the log should look like. It’s time to put all this effort into practice. Prior to going on-line, with all sites, we will perform a trial run at a single site. We will be looking for how well the collected data, forms and other platforms are combined to provide the desired outcome; seeking to verify that the log editor will be able to perform and deliver the log in a timely manner; and using the beta site as a training tool for the in-house editor.
Conclusion:
In this series, we have seen the lesson provided by Major League Baseball in the area of statistical evaluation. In an effort to make their teams better, MLB managers moved away from traditional reporting. We started to define what is meant by a “log-based documentation” platform and how it differs from traditional production reports currently being used.
In part two, we took a deeper look at what is at the core of the log. We learned what vital signs are, and how best to use them. By adding the evaluation step, we are able to support the manager’s ability to quickly digest the data. The log is formatted to provide an advantage in having a straightforward technique to reconstruct any given day. The takeaways from a log-based documentation platform are that it:
- is site-specific, interactive, and directed at local management;
- quickly provides a distilled version of the health of the plant;
- challenges the manager toward positive improvement;
- adds the extra step of evaluation of data, looking for trends; and
- provides an archive of operational performance that can be referred to at any time.
If you are not content with your current production reporting, or with how that reporting is used to improve the overall operation, you have another option. You can consider the log-based platform to drill down to and use the vital signs of your site.

Ken Monlux
Ken Monlux is an asphalt industry veteran with 30 years experience in all areas of operational management. For more information, contact him at (209) 495-1017 or kenmonlux@yahoo.com.