Measure and Manage Months in Backlog
BY Sean Rizer
In this month’s Off the Mat article, we will discuss how the highest performing paving contractors use the months-in-backlog analytic to drive the decision of procuring new project opportunities. Evaluating how much work you have on the books at a given point in time is critical to a paving company being able to accurately predict and project its next few months of operating results.
Backlog is an ever-changing calculation. As new work comes in, backlog increases, and as work is performed, backlog decreases. For paving companies that have long-term projects, the months in backlog analysis will be easier to calculate as there are typically fewer projects to have to consider. It is also customarily easier to schedule, coordinate and mobilize on a few larger projects as compared to a multitude of smaller projects.
Backlog is considered uncompleted work that is awarded via executed contract. Pipeline open bids, which are open proposals, are not included in the actual backlog figure, because these are not “hard” contracts. Pipeline open bids are important in understanding the historical win rate the contractor has when determining how close the contractor is to its targeted backlog figure.
In a previous Off the Mat article—Mitigate Contractor Risk—we discussed contractor failure and contractors who do not understand the relationship of man hours available to work compared to actual contracted man hours to be completed in a given season. This can create significant operational challenges for a contractor to be profitable. For instance, too much work at a low margin may cause the contractor to not hit its profitability goals.
Months in backlog can have multiple definitions; let’s review three of those formulas now.
Sales months in backlog is the number of months of backlog a paving company can perform based on the total gross sales (revenue) prior to any expenses deducted.
Backlog Months Sales Dollars X Gross Profit Percentage
(Avg. annual fixed cost + budgeted net profit)/12
One primary positive of the sales months in backlog calculation is it is the simplest of the three formulas. When communicating goals and expectations with the sales team, sales dollars is often the easiest term for employees to understand. When using sales as the driver for this analysis, it does not factor in the profitability of the backlog.
Gross profit months in backlog is the number of months of backlog a paving company can perform based on the total gross profit (revenue less direct costs of construction).
Backlog Months X Gross Profit Dollars
(Avg. annual fixed cost + budgeted net profit)/12
The advantage of this analysis, compared to the sales approach, is it focuses on the actual dollars the paving contractor has left over after performing the work.
Challenges in using this method broadly are having to educate the team on the definition of direct costs and the results of the direct costs are not in control of the sales team member. This method is better served to convey to those charged with estimating work and not actually selling the work.
Labor hours months in backlog is the number of months of work on the books a paving company has based on the total field labor man hours available.
Backlog Months Labor Hours X Avg. Gross Profit Per Labor Hour
(Avg. Annual fixed cost + budgeted net profit)/12
In our industry, skilled labor availability continues to be a challenge. When evaluating months in backlog, the analysis that yields the most accurate results uses labor hour months in backlog. This analysis does require the most attention to detail and understanding how accurate the estimates are on a job-by-job basis. The sales figure and estimated cost dollars need to be correct to give the projected gross profit on the project and the estimated number of labor hours needs to be correct for this analysis to be accurate.
The main downfall with this analysis is the detailed level of information required is so much greater than the previous two, that it creates additional opportunity for inaccurate information to be used in the analysis. That, in turn, would give an inaccurate projection of the months in backlog.
This method is best used to communicate with the operations team tasked with scheduling the projects.
Backlog in Practice
As a case study, using the five variables below and the three scenarios above, these would yield approximately 12 months in backlog.
- 30,000 crew hours for the upcoming paving season
- Backlog sales of $14,000,000
- An average gross margin of 18%
- Fixed costs of $1,200,000
- Net profit budget of $1,300,000
When evaluating months in backlog, it is important to know this is a theoretical formula. An important factor to consider is the timing of the work. Just because the contractor has 12 months backlog of work doesn’t mean the projects will be spread evenly throughout the next 12 months.
The next step after determining the theoretical months in backlog would be to take the projects and allocate them over the next several months. This will allow the paving contractor to identify potential holes or shortfalls in the schedule as there is always a limiting constraint to how much work can get done in a month.
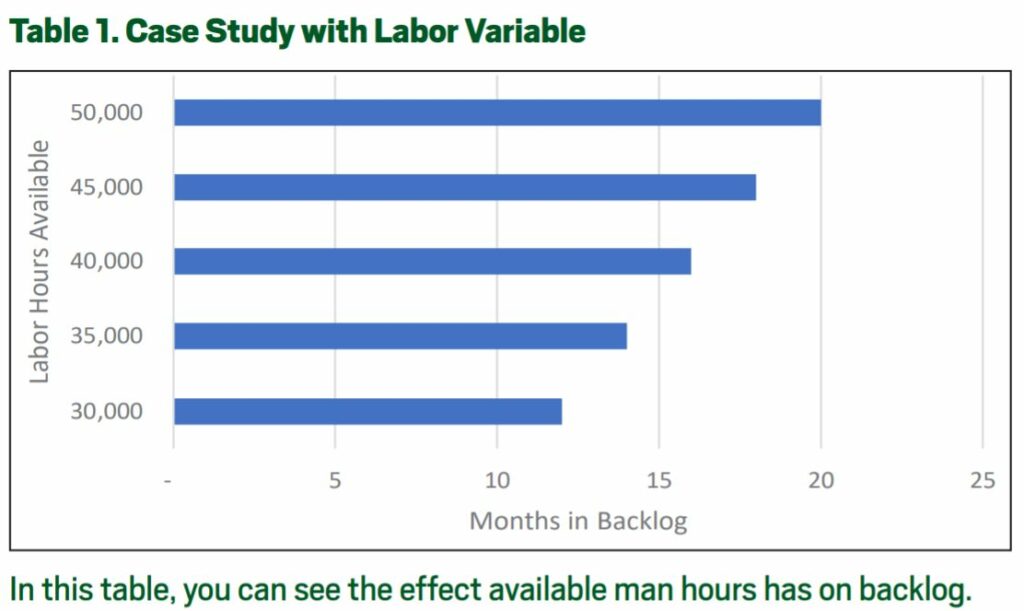
The months backlog analysis is a fluid formula and adjusting variables can have a significant impact on the results of the analysis, which is why we recommend performing a sensitivity analysis when evaluating months in backlog. For instance, if the above case study adjusted the number of man hours available and all other variables remained constant, Table 1 represents the impact that would have on the number of months in backlog.
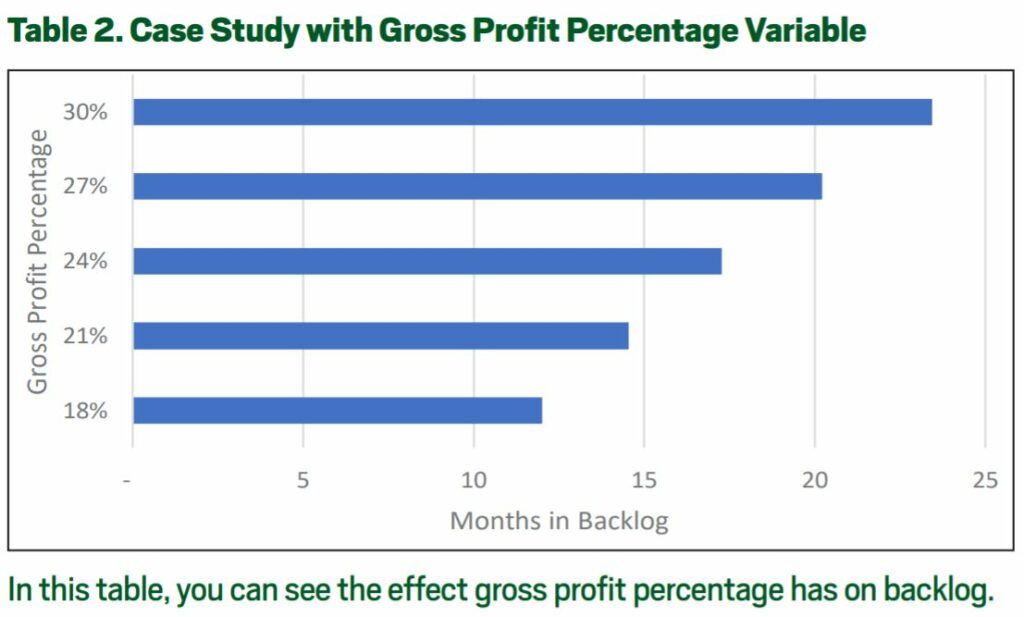
Another scenario to analyze would be if the average gross profit percentage would increase and all other variables would remain constant. See that result in Table 2.
This tool should be used as one of the key metrics management reports on a regular basis to ownership, sales, operations and estimating as the contractor evaluates its desired net profitability goals, workforce availability and new sales opportunities.
 Sean Rizer is the CFO for Harding Group, Indianapolis, Indiana, which performs asphalt services, supplies hot-mix asphalt and provides dump truck transportation. Prior to joining Harding Group, Rizer spent over 10 years in public accounting, providing operational and transactional consulting. He graduated from Valparaiso University with a bachelor’s degree in both accounting and finance.