ARTBA Estimates Slight Spending Boost in 2018
BY AsphaltPro Staff
The New Year is a time of new resolutions, predictions of the year ahead, and a time to reflect on the past 12 months.
As it does every year, ARTBA has published its U.S. Transportation Construction Market Forecast for 2018. Last year, ARTBA predicted a slight decrease, but the decline turned out to be more than they had predicted. This year, things are looking a bit brighter.
Overall, ARTBA is estimating a 3.2 percent increase in total domestic transportation construction in 2018 after last year’s 2.8 percent drop. They attribute that drop largely do a decline in state and local highway and bridge spending, which were down 6.4 and 7.7 percent, respectively.
However, ARTBA estimates that public and private highway, street construction and related construction markets will see a 2.4 percent increase in 2018 after last year’s drop.
ARTBA also forecasts improvements in a number of other sectors, including a 2.6 percent increase in the bridge and tunnel market, a 4.6 percent increase in public transit and rail construction, and an impressive 14 percent increase for airport runways and terminals.
The biggest markets for overall growth include California, Florida, Hawaii, New York, Virginia and Washington, and the markets ARTBA expects to most significantly slow down include Arizona, Colorado, Delaware, Maryland, Nevada and Oklahoma.
Highways and Bridges
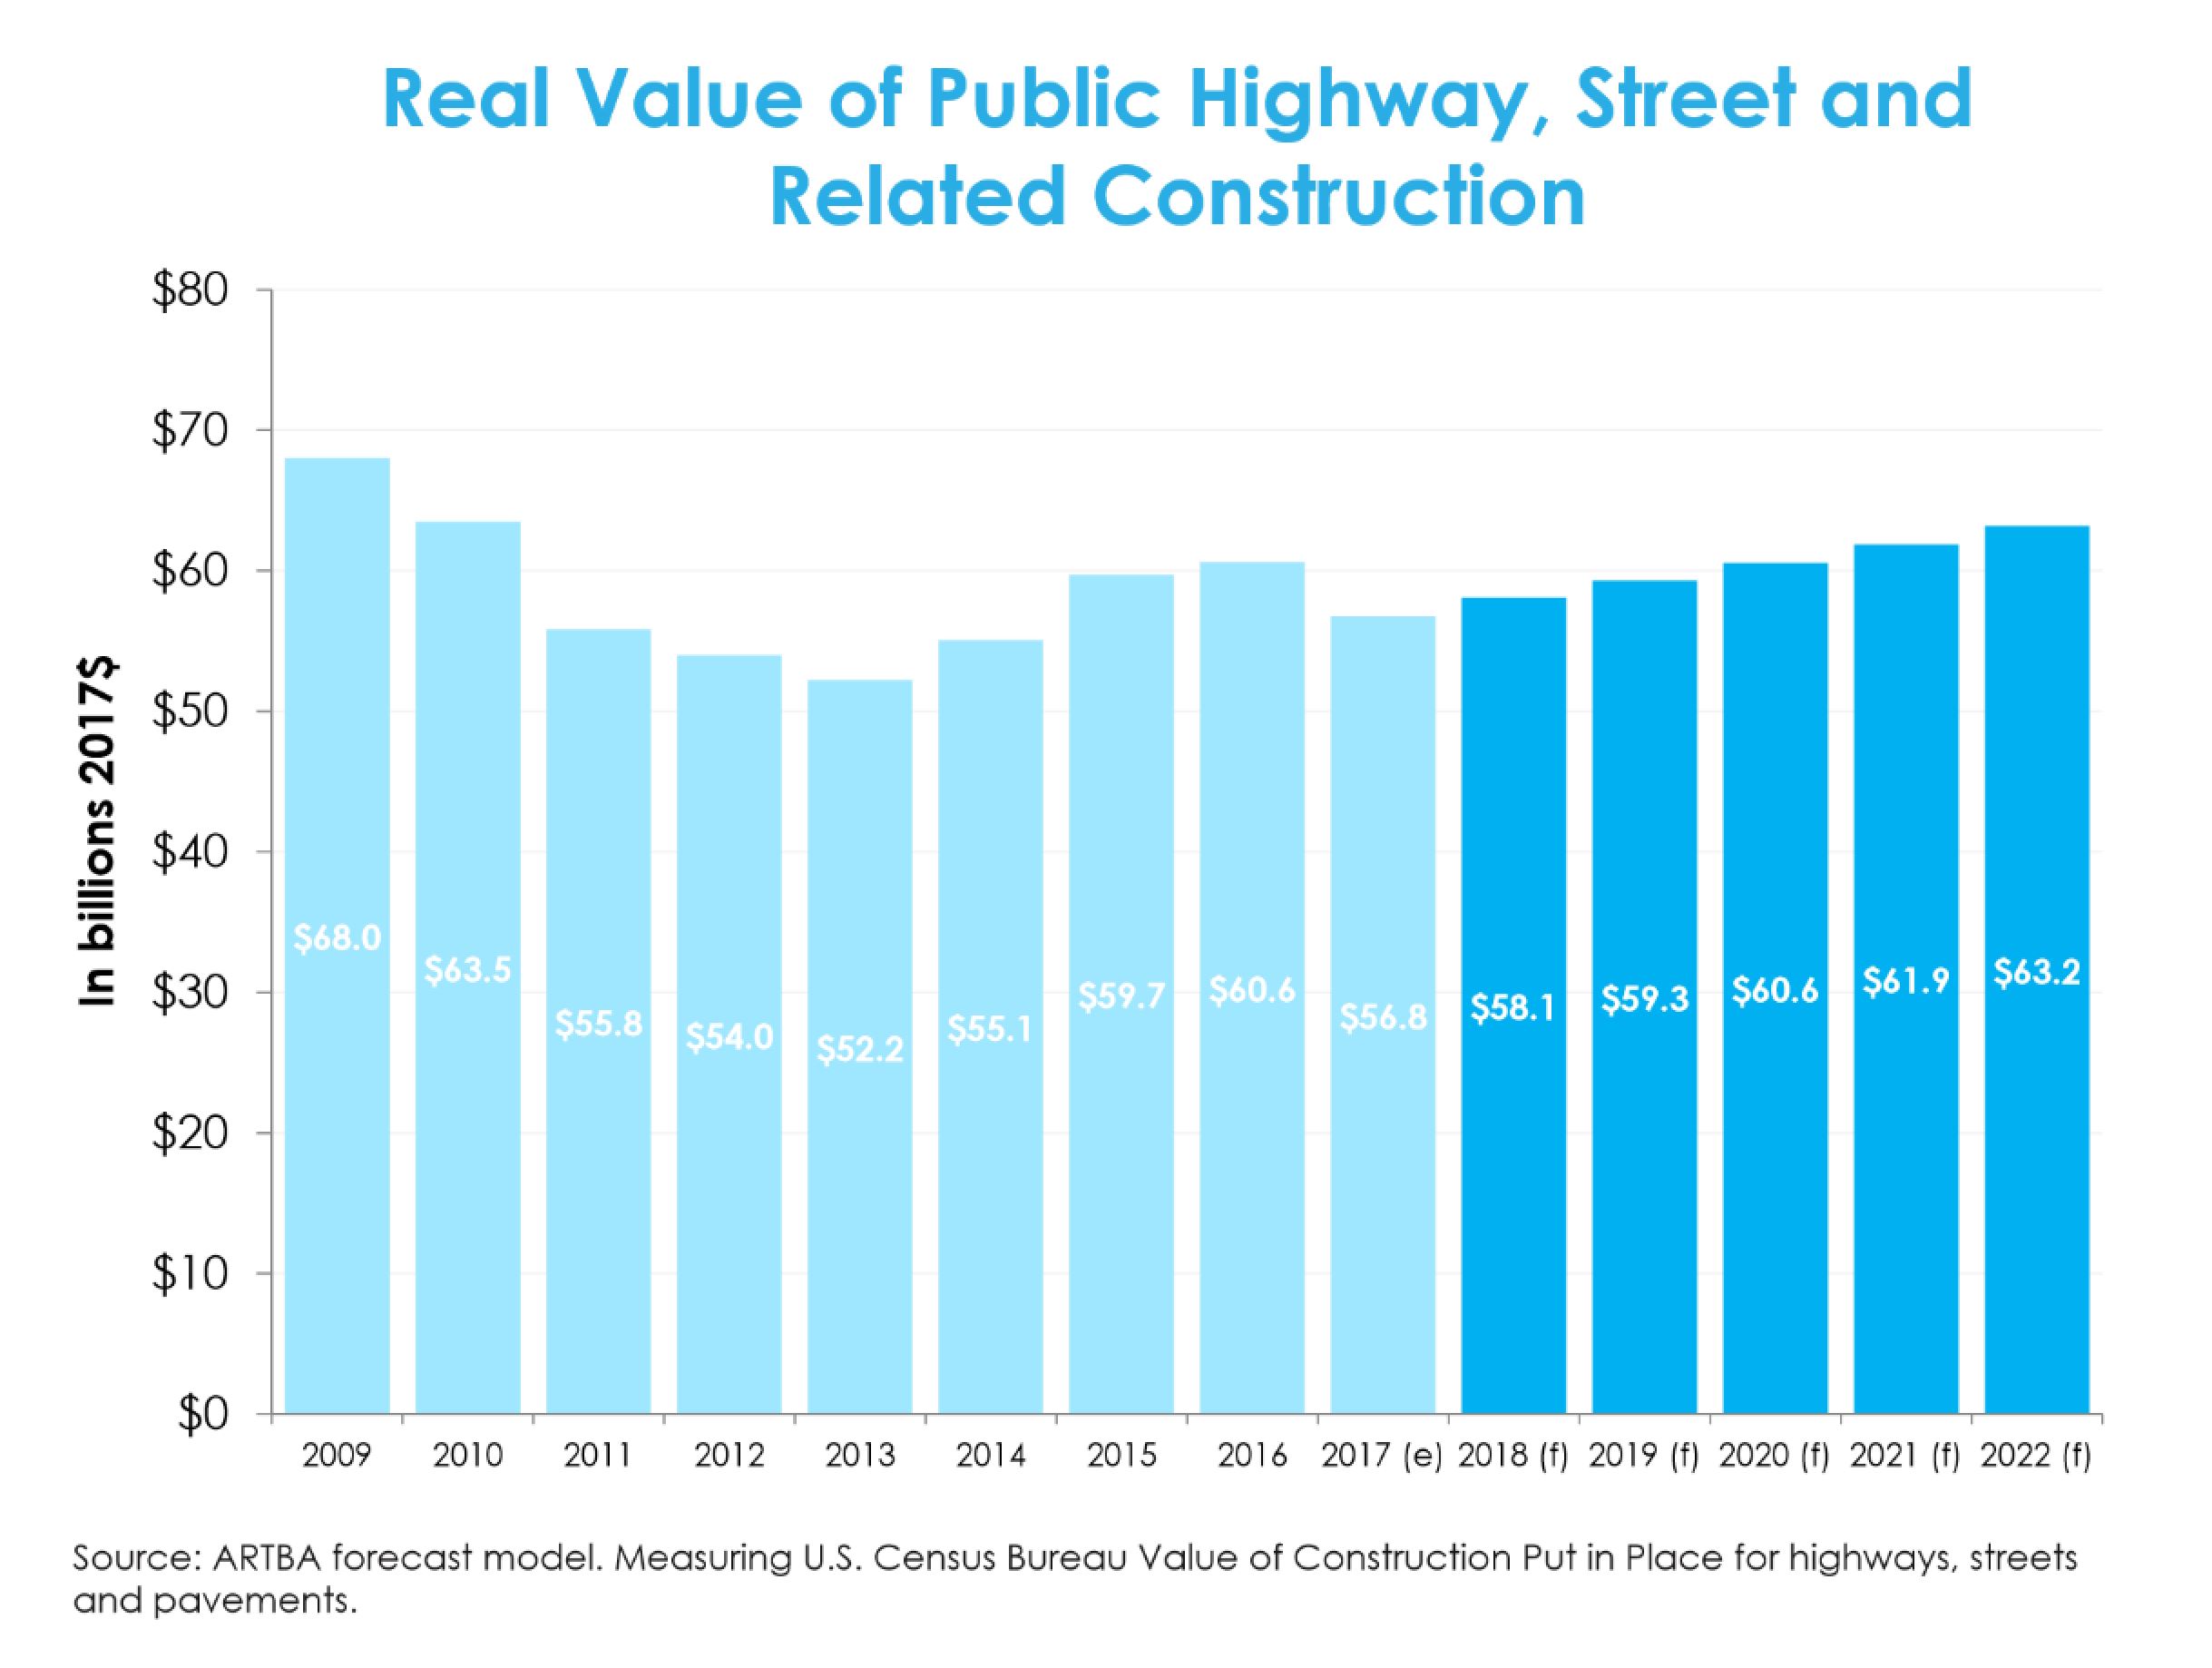
Although ARTBA is expecting a slight increase in this sector of the transportation construction market, it comes at what the organization hopes will be the end of a downward-oriented trend.
The real value of public highway, street and related construction in 2009 was $68 billion. That dropped down to $52.2 billion in 2013, and had begun to climb upwards again to $60.6 billion in 2016, before dipping down again to $56.8 billion last year.
Over the next five years, ARTBA is predicting slow but steady growth, up to $63.2 billion in 2022.
“The fundamentals of this market are positive,” said ARTBA’s Senior Vice President and Chief Economist Alison Premo Black. “There’s a lot going on that could help support further growth in the coming years.”
However, this positive outlook is very regional.
“Even though the national numbers are down, states, regions and even major urban areas are seeing strong potential for growth over the next few years,” Black added.
Some of the overall pullback in the highways and bridges sector, Black said, can be attributed to the completion of major bridge projects, including a new bridge in New York and another over the Ohio River.
“As those projects finish, it’s normal to see a pause in this market,” Black said.
Over the long term, maintenance outlays for highways, streets and bridges have continued to trend upwards, from $37.7 billion in 2009 to $42.6 billion in 2016. Although we saw a dip last year to $40.1 billion, ARTBA expects maintenance investments to grow to $47 billion in 2022.
Behind the Numbers
One big question ARTBA has been trying to answer in this market is how there can be a decline for road and bridge construction when revenues are up. Black tried to put this phenomena into context with a number of graphs.
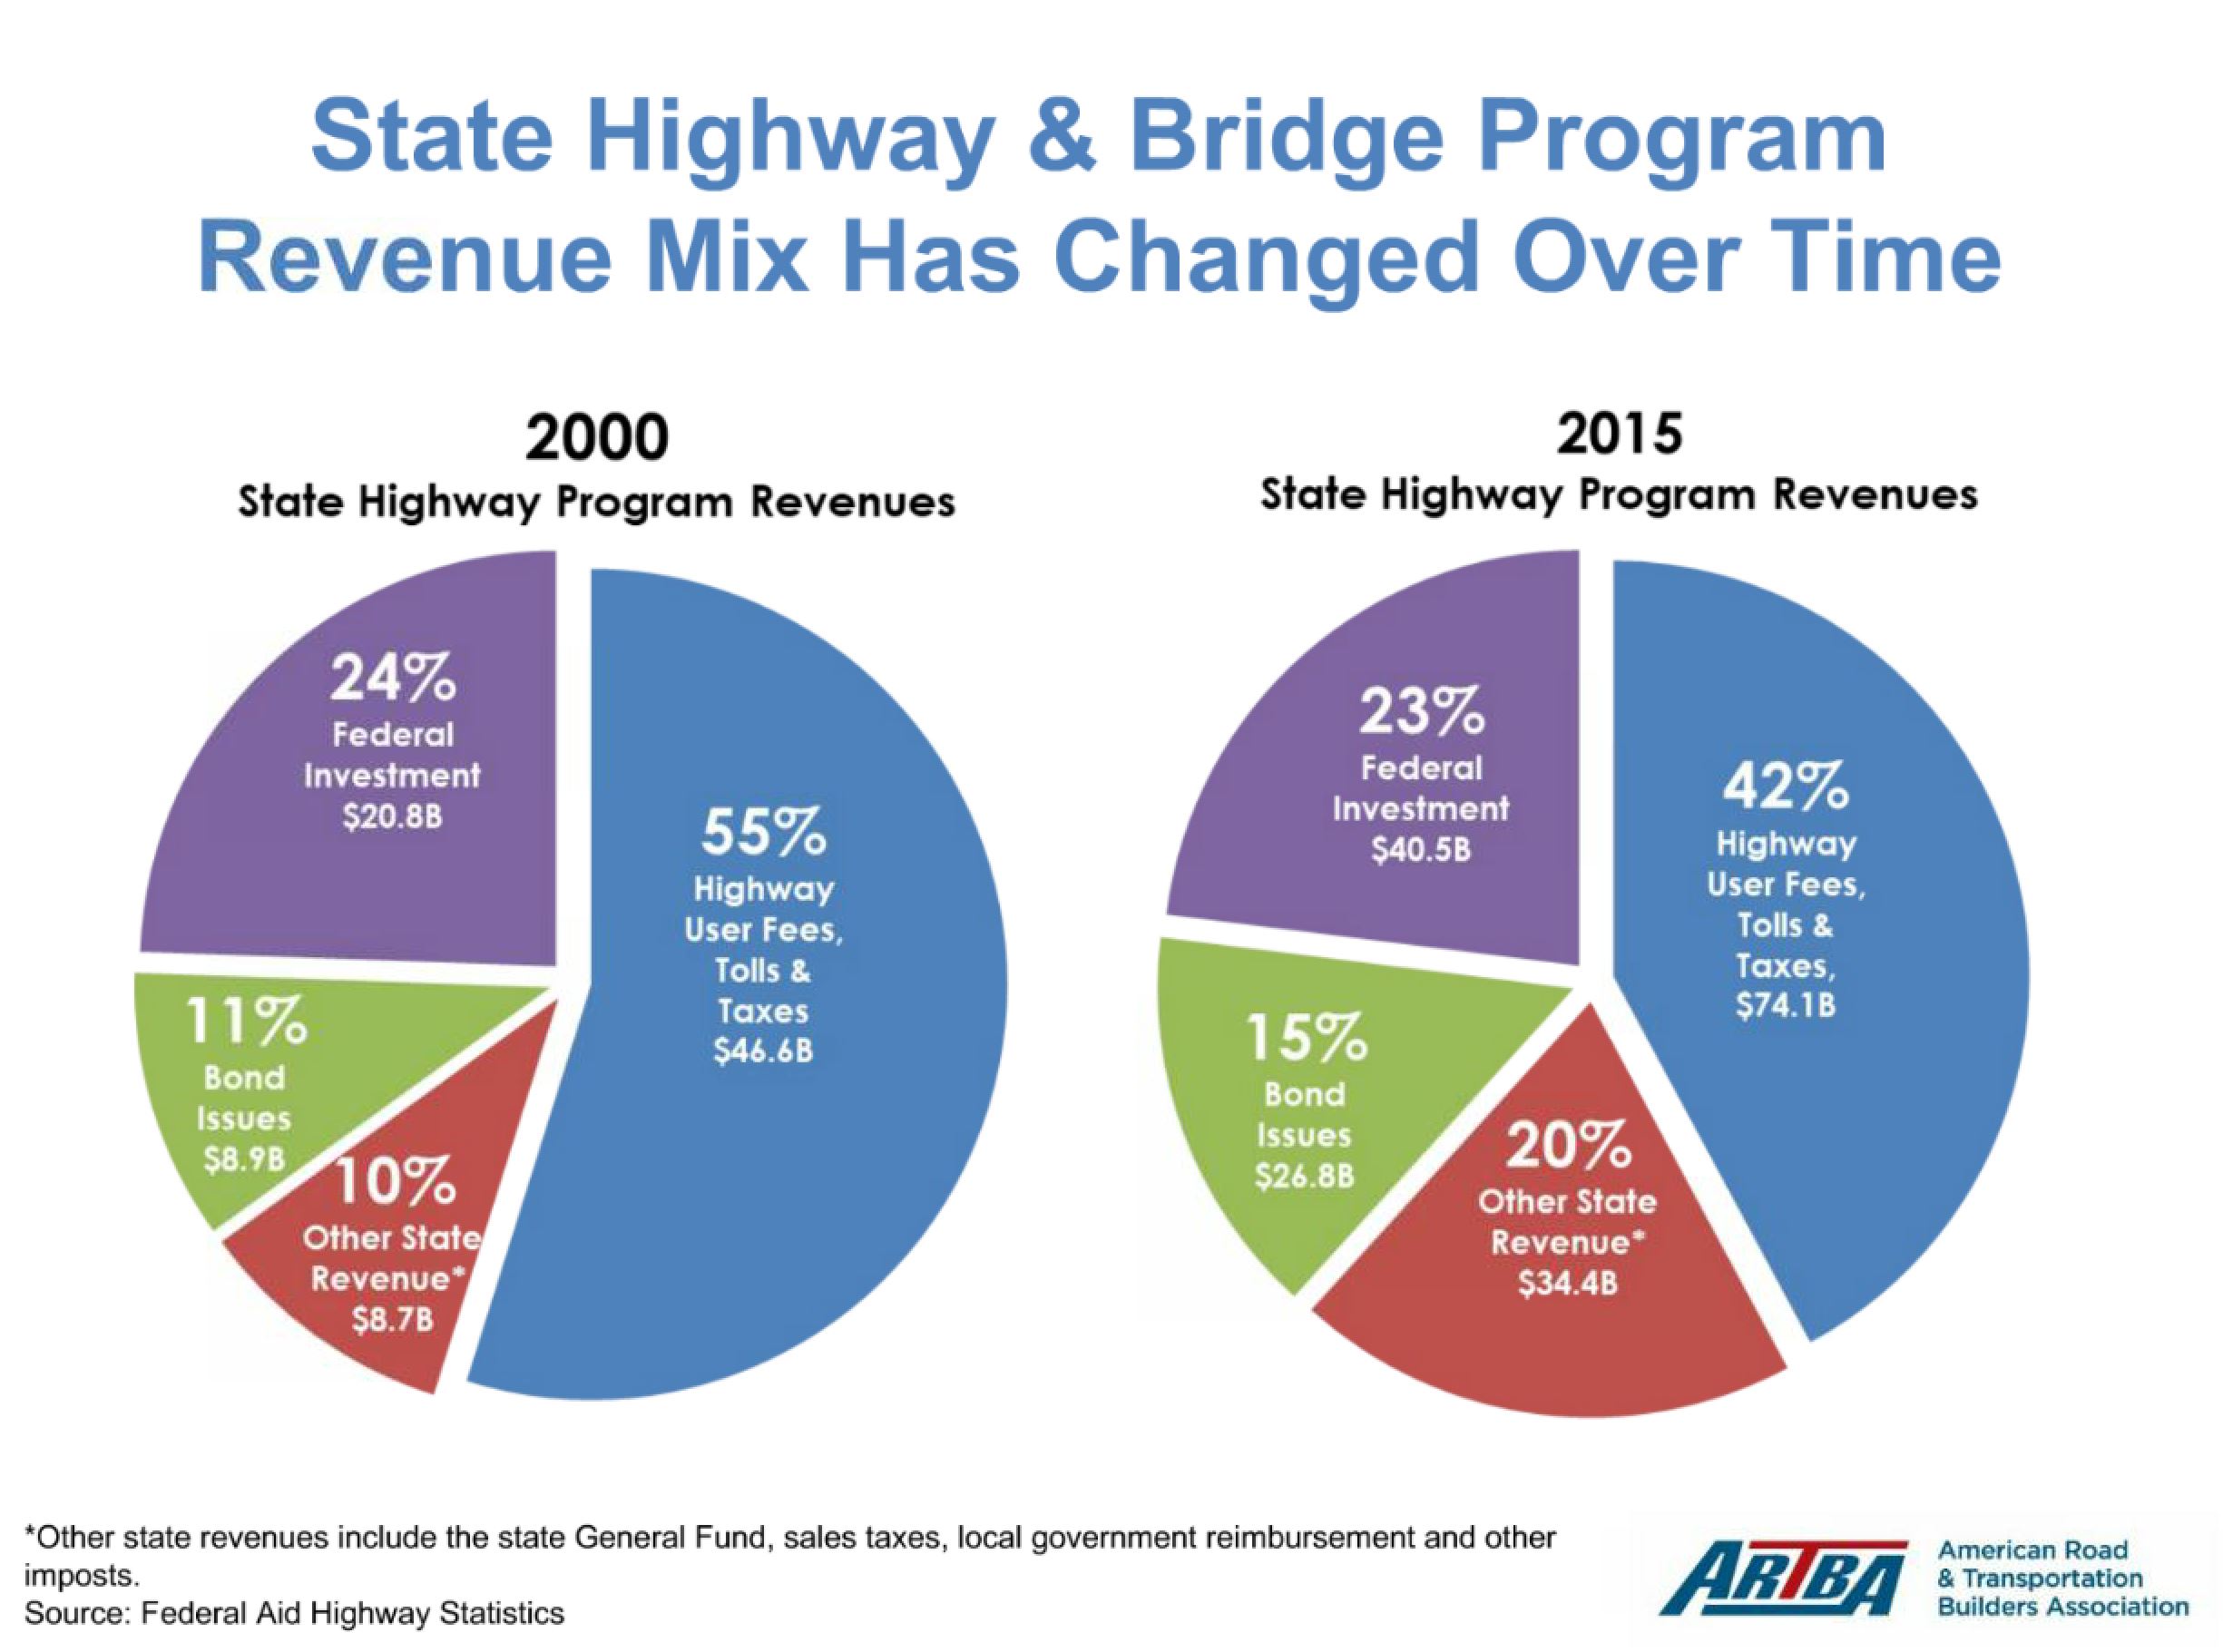
In 2000, more than half of all funding for state highway programs came from highway user fees, tolls and taxes. One quarter came from federal investment, 11 percent from bond issues, and 10 percent from other sources.
In 2015, revenue from highway user fees, tolls and taxes had dropped by more than 10 percent, federal funding had remained the same, and revenue from bond issues and other sources had grown to 15 and 20 percent, respectively.
The most significant change, though, comes when we look at how that money is being spent.
“More is being used to pay off debt and for public transit, law enforcement and non-transportation purposes,” Black said.
Capital outlay, maintenance and administration decreased from 42 cents of every dollar spent from the highway user fee, tolls and taxes category to 29 cents from 2000 to 2015, while debt services and bonds increased from 5 cents per dollar to 15 cents per dollar and public transit increased from 4 cents to 12 cents per dollar. Spending for law enforcement and non-highway related expenses also increased, from 5 cents each in 2000 to 9 cents each in 2015.
Another significant funding challenge is an overall budget crunch, particularly at the state level.
Thirty-three states saw general revenues coming in below what had been expected for fiscal year 2017. And, although only 4 percent of states’ general funds go towards transportation directly, money from the transportation funds is often used to plug in budget holes.
Due to the budget challenges, 10 states cut general fund spending on transportation in 2017, 13 states will be cutting general fund transportation spending in 2018, and 10 states used transportation-related fees to manage their 2017 budgets.
Opportunities for Improved Funding
Despite lukewarm predictions, voter support for transportation funding is strong, Black said, with voters approving $4.25 billion in transportation funding Nov. 7.
“This is an indicator of broad support at the state and local level for transportation funding,” Black said.
Here are some of the new funding measures, according to the Transportation Investment Advocacy Center’s State Funding Initiatives Report published June 2017:
– 21 states approved one transportation funding bill between 2015 and 2017
– 20 additional states approved two transportation funding bills in that same time frame
– 6 states approved fuel tax increases in 2017
– 4 states implemented or adjusted variable rate gas taxes
– 6 states approved other recurring revenues for transportation
– 9 states approved alternative fuel and electric vehicle taxes or fees
– 1 state approved transportation lockboxes
– 5 states approved one-time funding measures
Another new trend from quite a few states is the passage of second initiatives. For example, Georgia passed an initiative to increase state funding, and then the legislature also began to allow local agencies at the county level to raise funds.
FAST Acts and Trust Funds
“We do hear a lot of questions about the impact of the FAST act, the stability of a 5-year bill, and how bad continuing resolutions are for the industry,” Black said. But we have some data that shows that long term bills do provide market stability.”
The percent of federal highway funds obligated in the fourth quarter of the federal fiscal year dropped from 45 percent to 37 percent from 2016 to 2017, and funds obligated in the last month of the federal fiscal year dropped from 24 percent to 19 percent.
“States were holding onto money until the end of the year, so the market only had access to drips and drabs throughout the year,” Black said. “In 2017, we returned to a normal pattern.”
The real challenge, Black said, is longer term, with the Highway Trust Fund revenue crisis expecting to return.
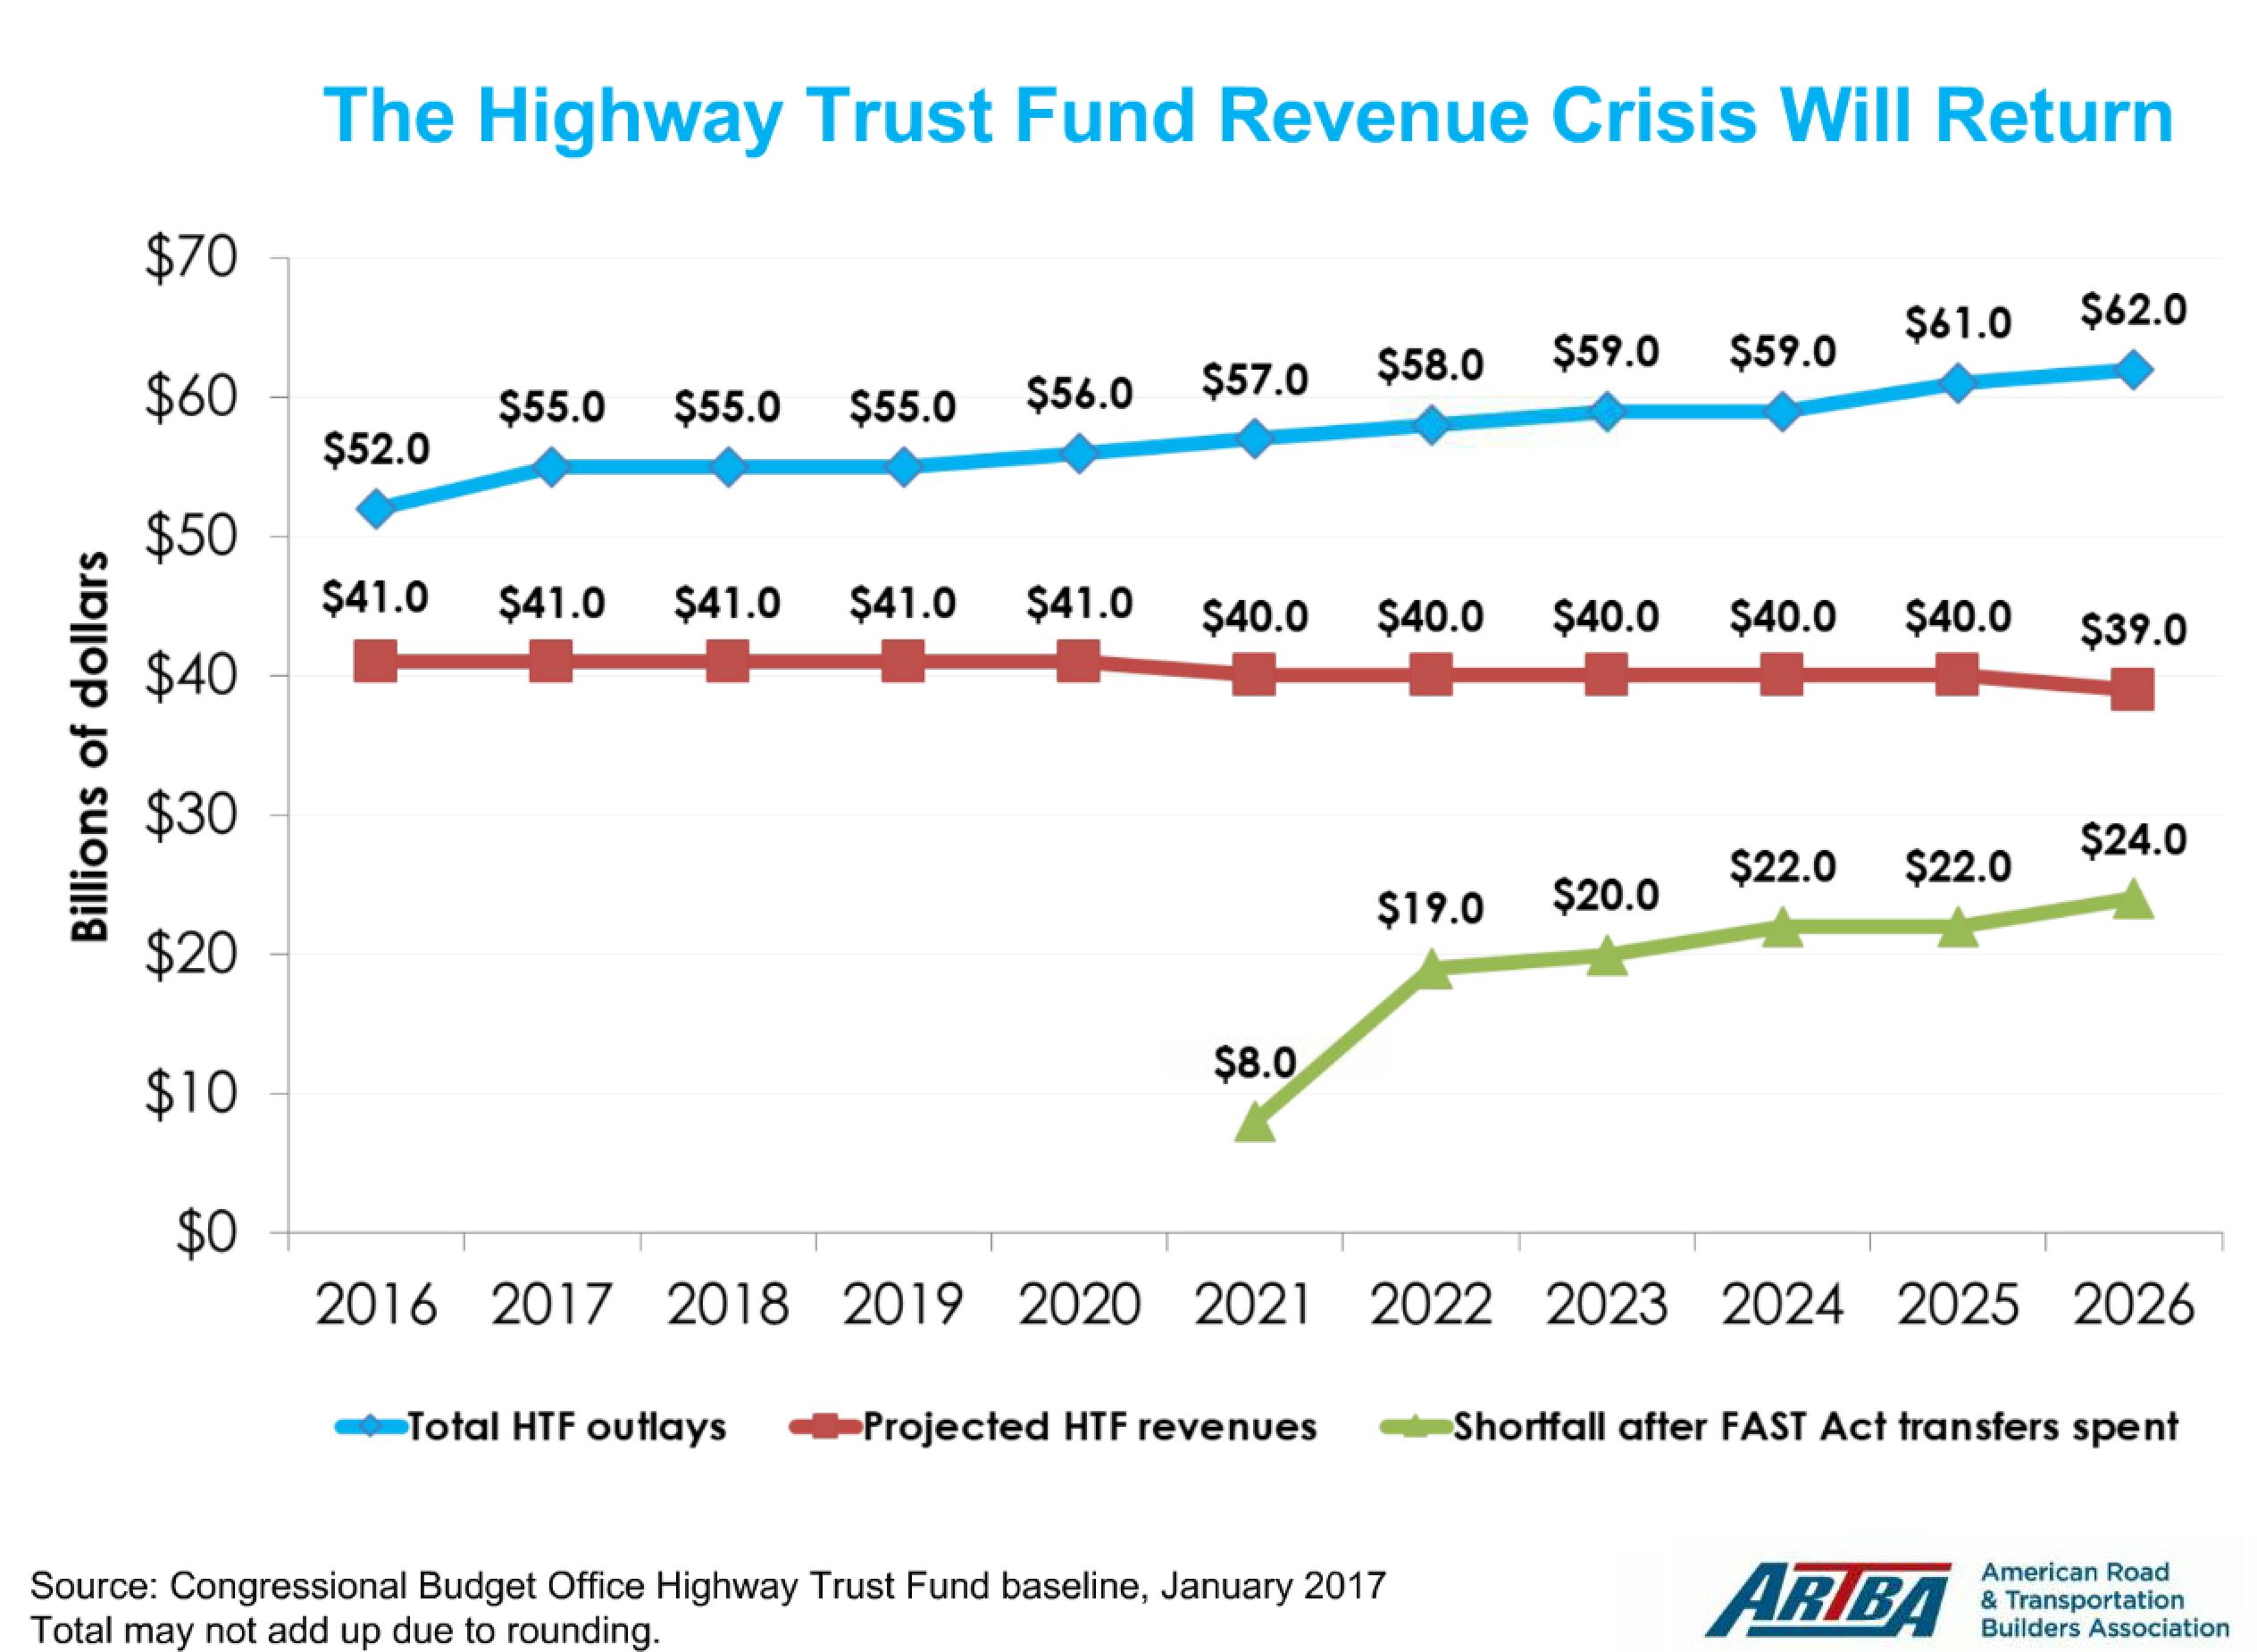
Although ARTBA doesn’t expect this to be an issue in 2018, it expects the expansion of the gap between HTF revenues and outlays in 2020 to impact the market in 2019 and 2020.
Industry Optimism, Industry Pessimism
Also part of ARTBA’s report is the contractors’ own outlook at the market. Almost half of contractors surveyed expect normal or above normal growth in the next 12 months. This optimism has been trending upward since a low of 4 percent in the third quarter of 2011, spiking at 60 percent and 59 percent in Q1 of 2016 and 2017, respectively.
However, 42 percent expect sluggish growth over that same period, and 11 percent expect a recession.
Despite varying opinions from contractors, ARTBA’s forecasts have a history of closely mirroring actual transportation construction funding values.
Although we can all wish for substantial growth in 2018, ARTBA’s estimated slight increase is probably right on the money.
Airport Terminals and Runways
“Airport terminals and runways are a really bright spot [in the report],” Black said. “There’s a lot getting underway there.”
These trends are expected to match total U.S. passenger enplanements, which have increased by nearly 100 million from 2013 to 2017.
Although ARTBA is expecting a substantial increase in funding for airport terminals and runways—up 14 percent from 2017 to 2018 alone—the major opportunity for growth in this area is for airport terminal construction, rather than runway construction, Black said.
Runway investments have been all over the board since 2009: up and down, with a big dip down in 2017. They’re expected to increase year upon year through 2022.
Terminal and related investments are expected to see the real growth, consistently increasing since 2014.
The Future of our Fleets
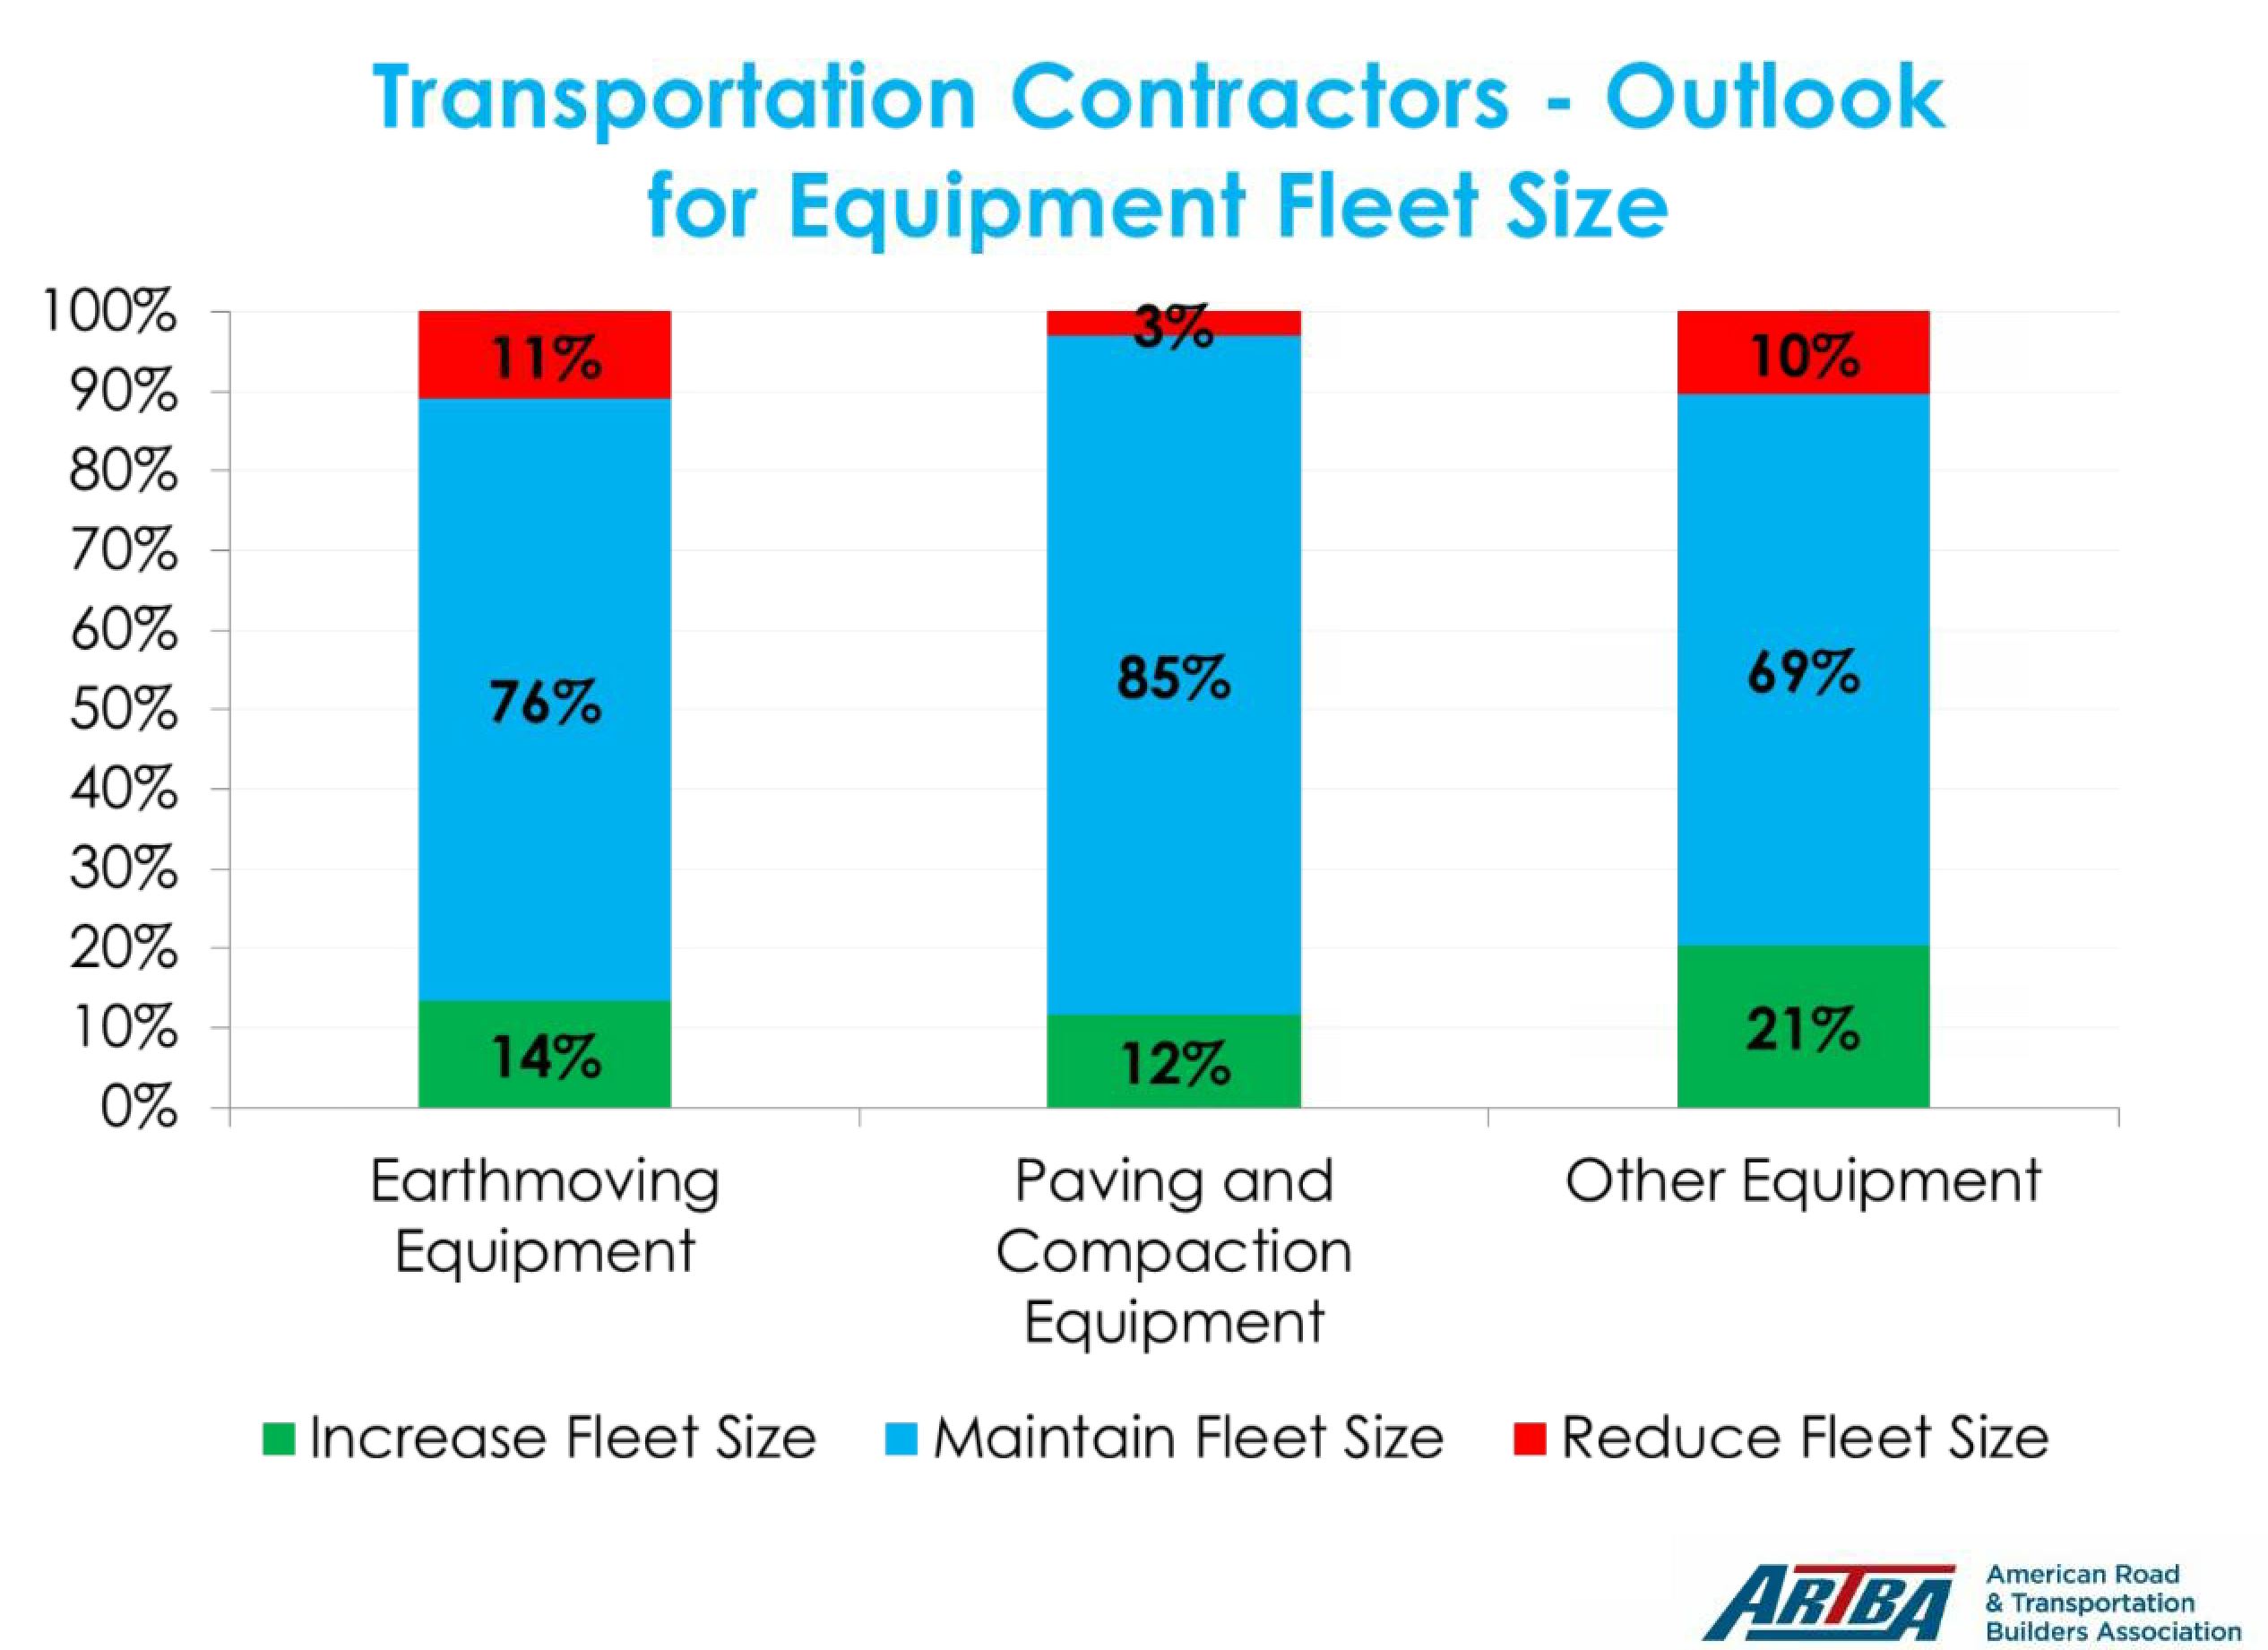
As part of ARTBA’s contractor survey, they ask for contractors’ outlook for equipment fleet size. The vast majority of transportation contractors expect to maintain their fleet size, which projects a perception of market stability. For paving and compaction equipment, the outlook is even more positive, with 12 percent expecting to grow their fleets and only 3 percent expecting to reduce fleet size.