Big Creek Sand and Gravel Doubles Production

For Charlie Harvey, crushing superintendent of Big Creek Sand and Gravel in Borger, Texas, achieving the production needed to meet recent demand meant investing in new equipment that could double—and in some cases triple—the operation’s output.

Production Meets Performance

Big Creek Sand and Gravel, formerly known as E.D. Baker Company, has been in operation for more than 20 years. The company offers a variety of services, including commercial aggregate sales, trucking, asphalt paving, earth work, wind generation work, highway construction and airport construction. Some of its major clients include the Texas Department of Transportation, Brazos Wind Ranch and Conoco-Phillips Company.

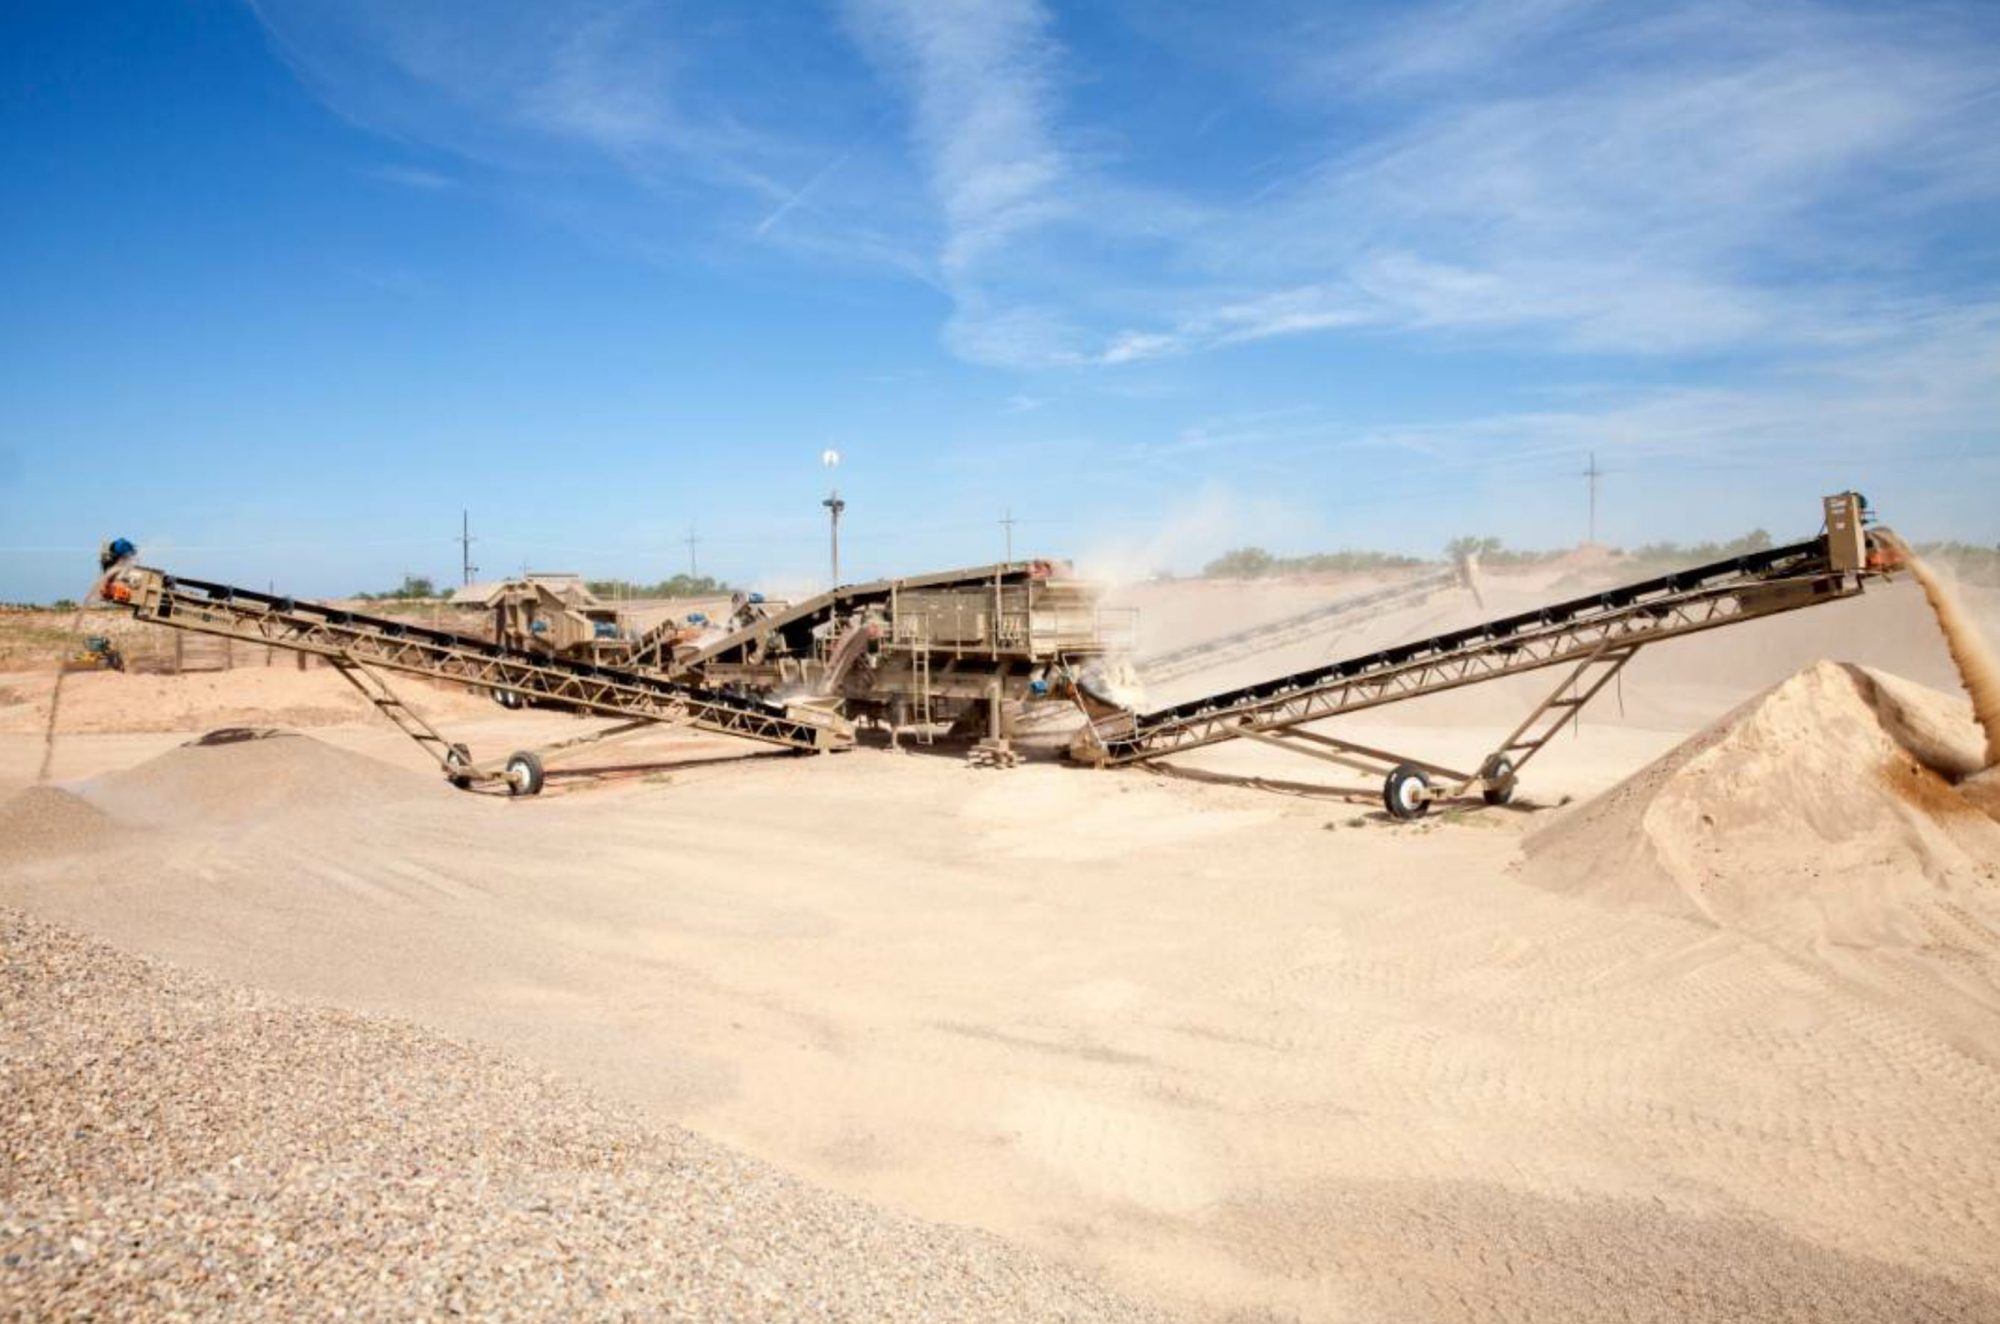
Knowing the company needed to increase production, Harvey began searching for a crushing spread that was highly portable, durable and high performing. The system that worked for his needs is the 2650 Pioneer® jaw crusher and the new K300/6203CC portable crushing and screening plant, which he purchased from authorized dealer Texas Bearing Company in Amarillo, Texas.

One of the key features that drew him to the Pioneer jaw crusher was the hydraulic dual wedge closed-side-setting (CSS) adjust, which eliminates manual shims and provides quick adjustment and enhanced safety, according to the manufacturer. The ability to adjust on the fly increases production by several hundred tons every time an adjustment is needed, Harvey said. He explained that their older crusher took about half a day to adjust manually. With the new crusher, “you’re going within minutes,” he said.

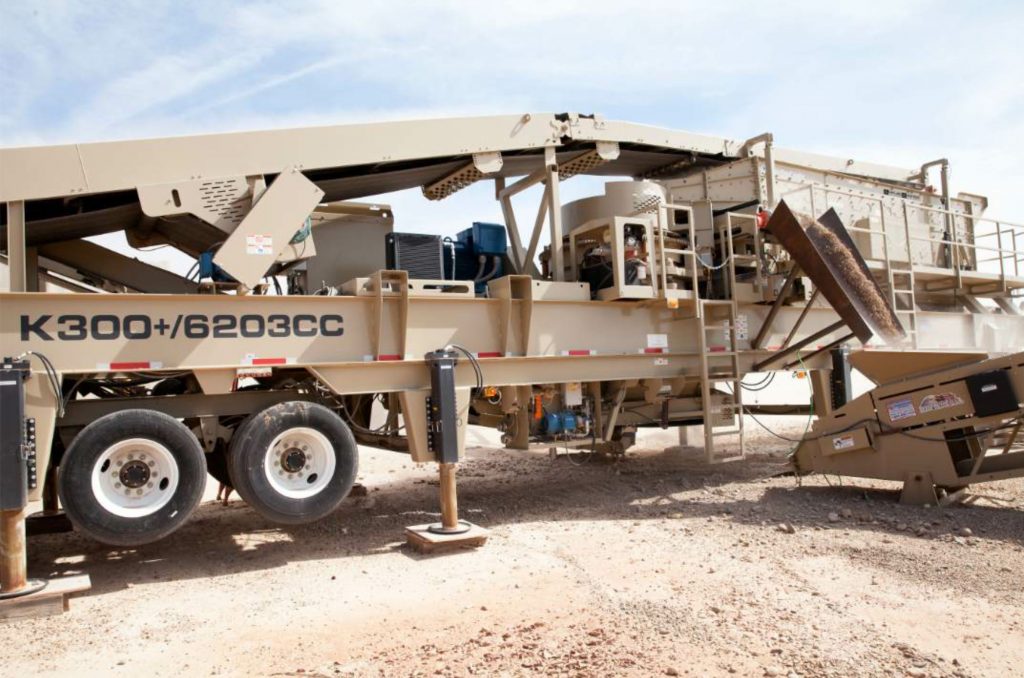
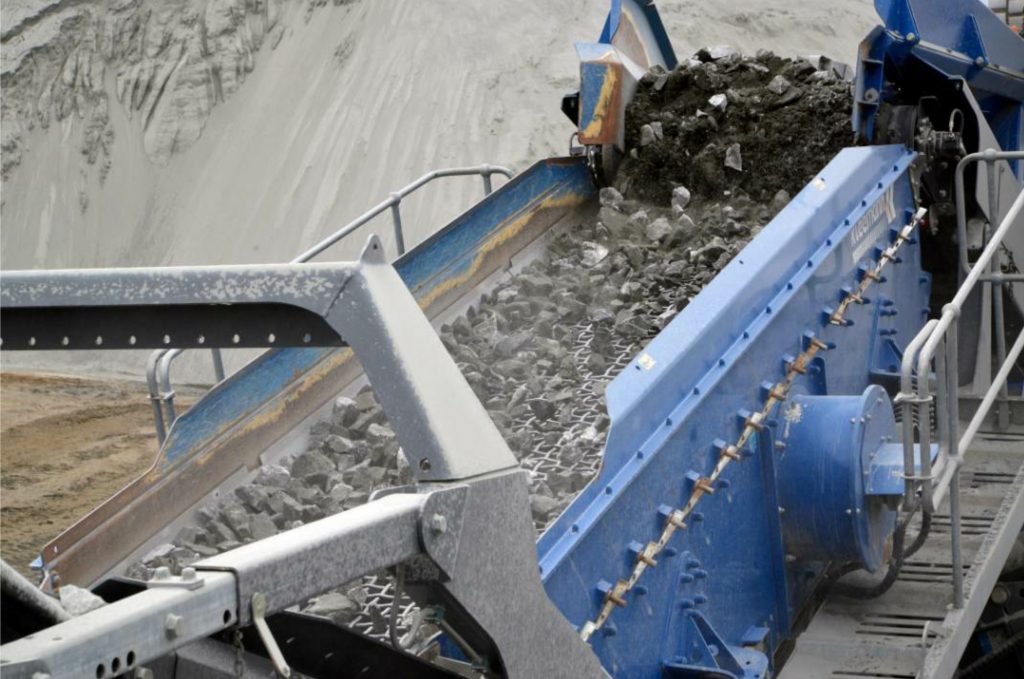
At Big Creek Sand and Gravel’s operation, the Pioneer jaw crusher feeds directly into the K300/6203CC, a newly-released plant that combines a heavy-duty, roller bearing Kodiak® Plus K300+ cone crusher with a triple-shaft, low-profile horizontal screen. In its closed-circuit configuration, the K300/6203CC allows producers to use a single chassis to produce up to three finished products or supplement existing demand in a small footprint, reducing the number of auxiliary conveyors they require.

Harvey estimated the old system produces less than 40 tons per hour making 3/8-inch minus rock. By using the Kodiak Plus K300+, that number tripled, he said. When making 1-1/4-inch minus material, his production increased so much that his loader couldn’t keep up, requiring him to switch to a larger loader.

“We couldn’t feed material fast enough making 1-1/4-inch minus,” Harvey said. “Even our larger Kawasaki 92ZV loader couldn’t keep up. We had to have our other loaders come back in and throw a bucket in whenever they had time.”

Screening Versatility

The addition of the new crushing spread meant additional screening power was needed on site, so Harvey sought out a mobile screening plant that could keep up with the increase in production.

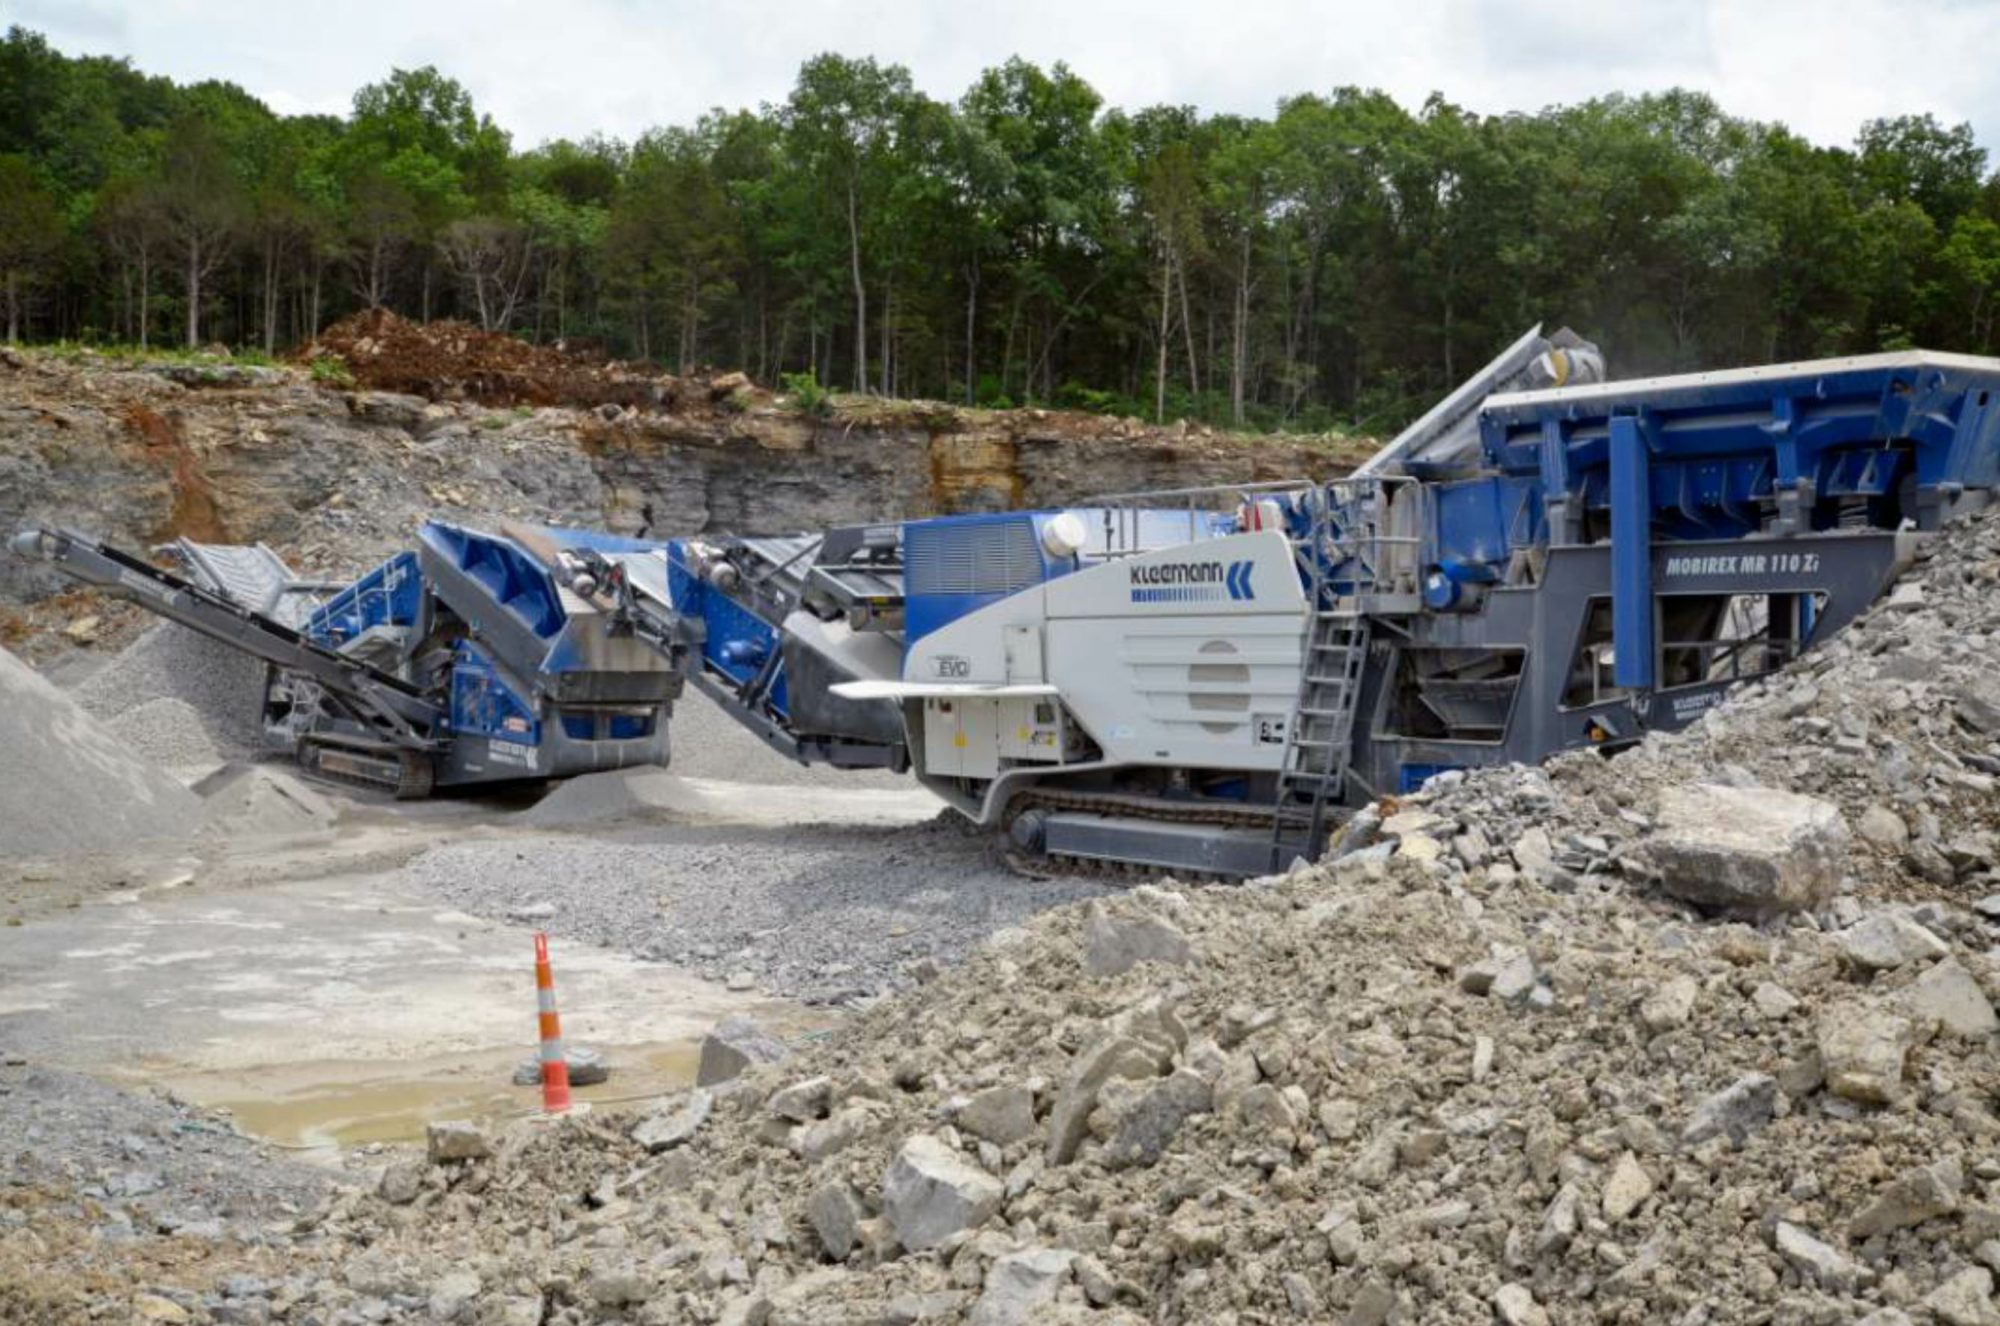
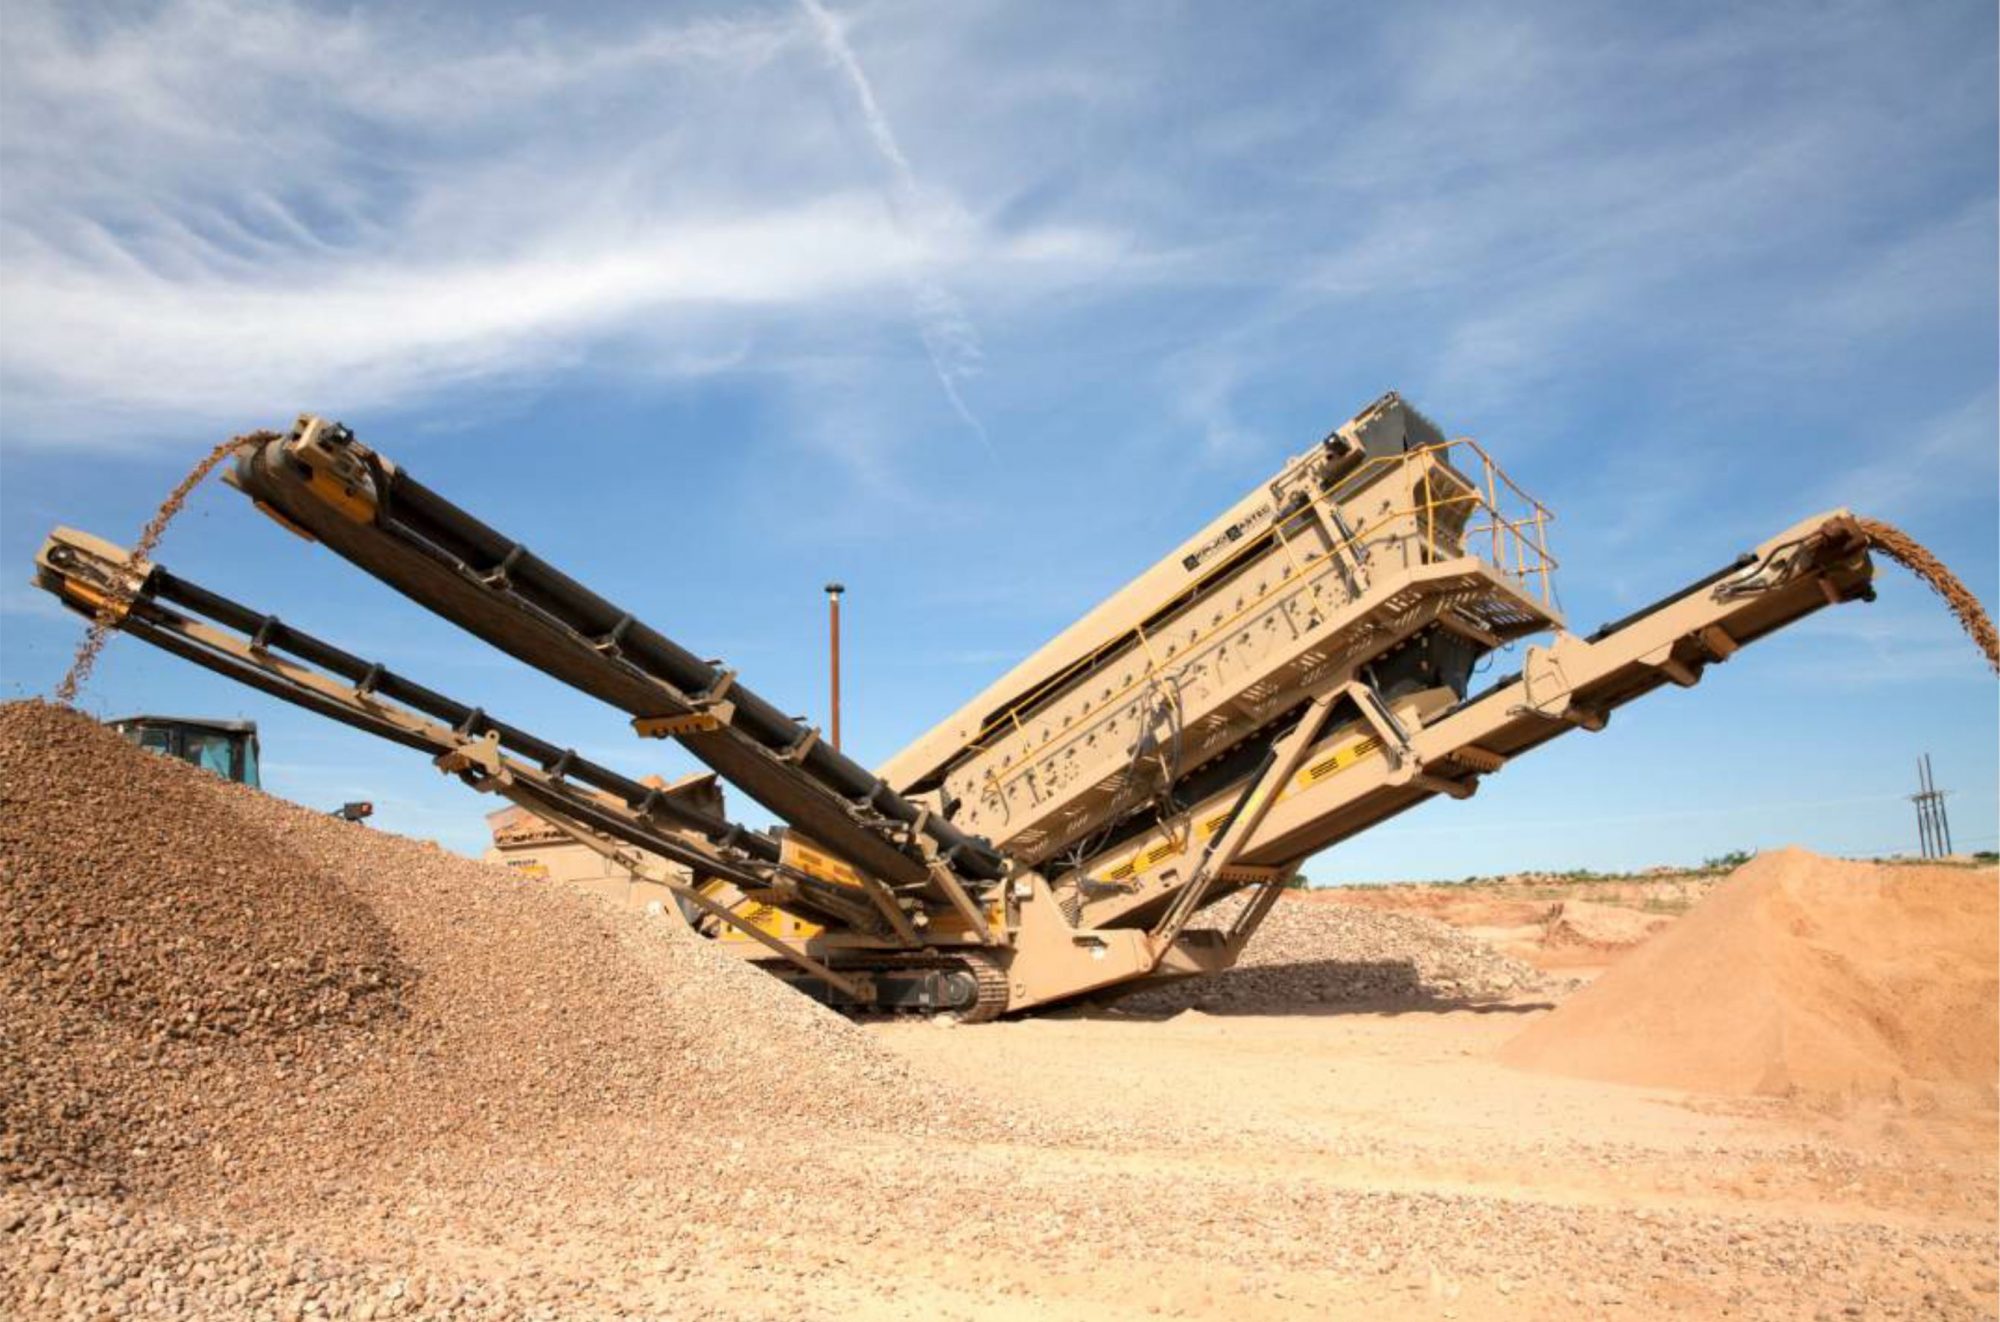
Already familiar with the GT205S—in 2012, the company purchased the very first GT205S from KPI-JCI and Astec Mobile Screens—Harvey decided to invest in a second unit. The GT205S is a double- or triple-deck track-mounted screening plant designed for producers processing sand and gravel, top soil, slag, crushed stone, and recycled materials.

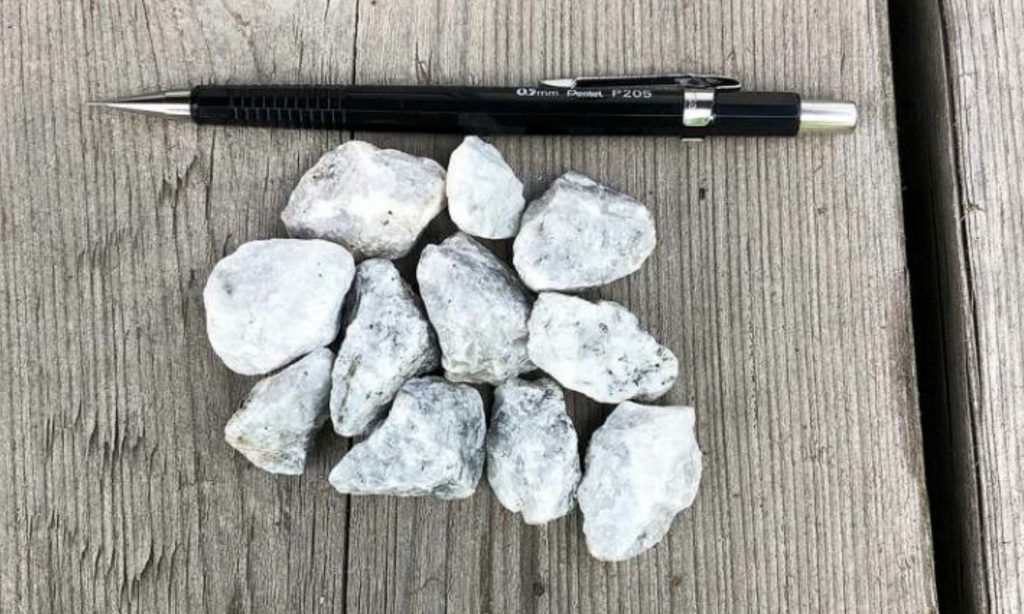
Harvey uses the GT205S to process concrete rock and hot-mix material. By using three screen decks, he is able to make A4 rock, a size of material the company previously had to discard. Now, Big Creek Sand and Gravel is able to avoid wasting material and can offer more products to its customers, he said.

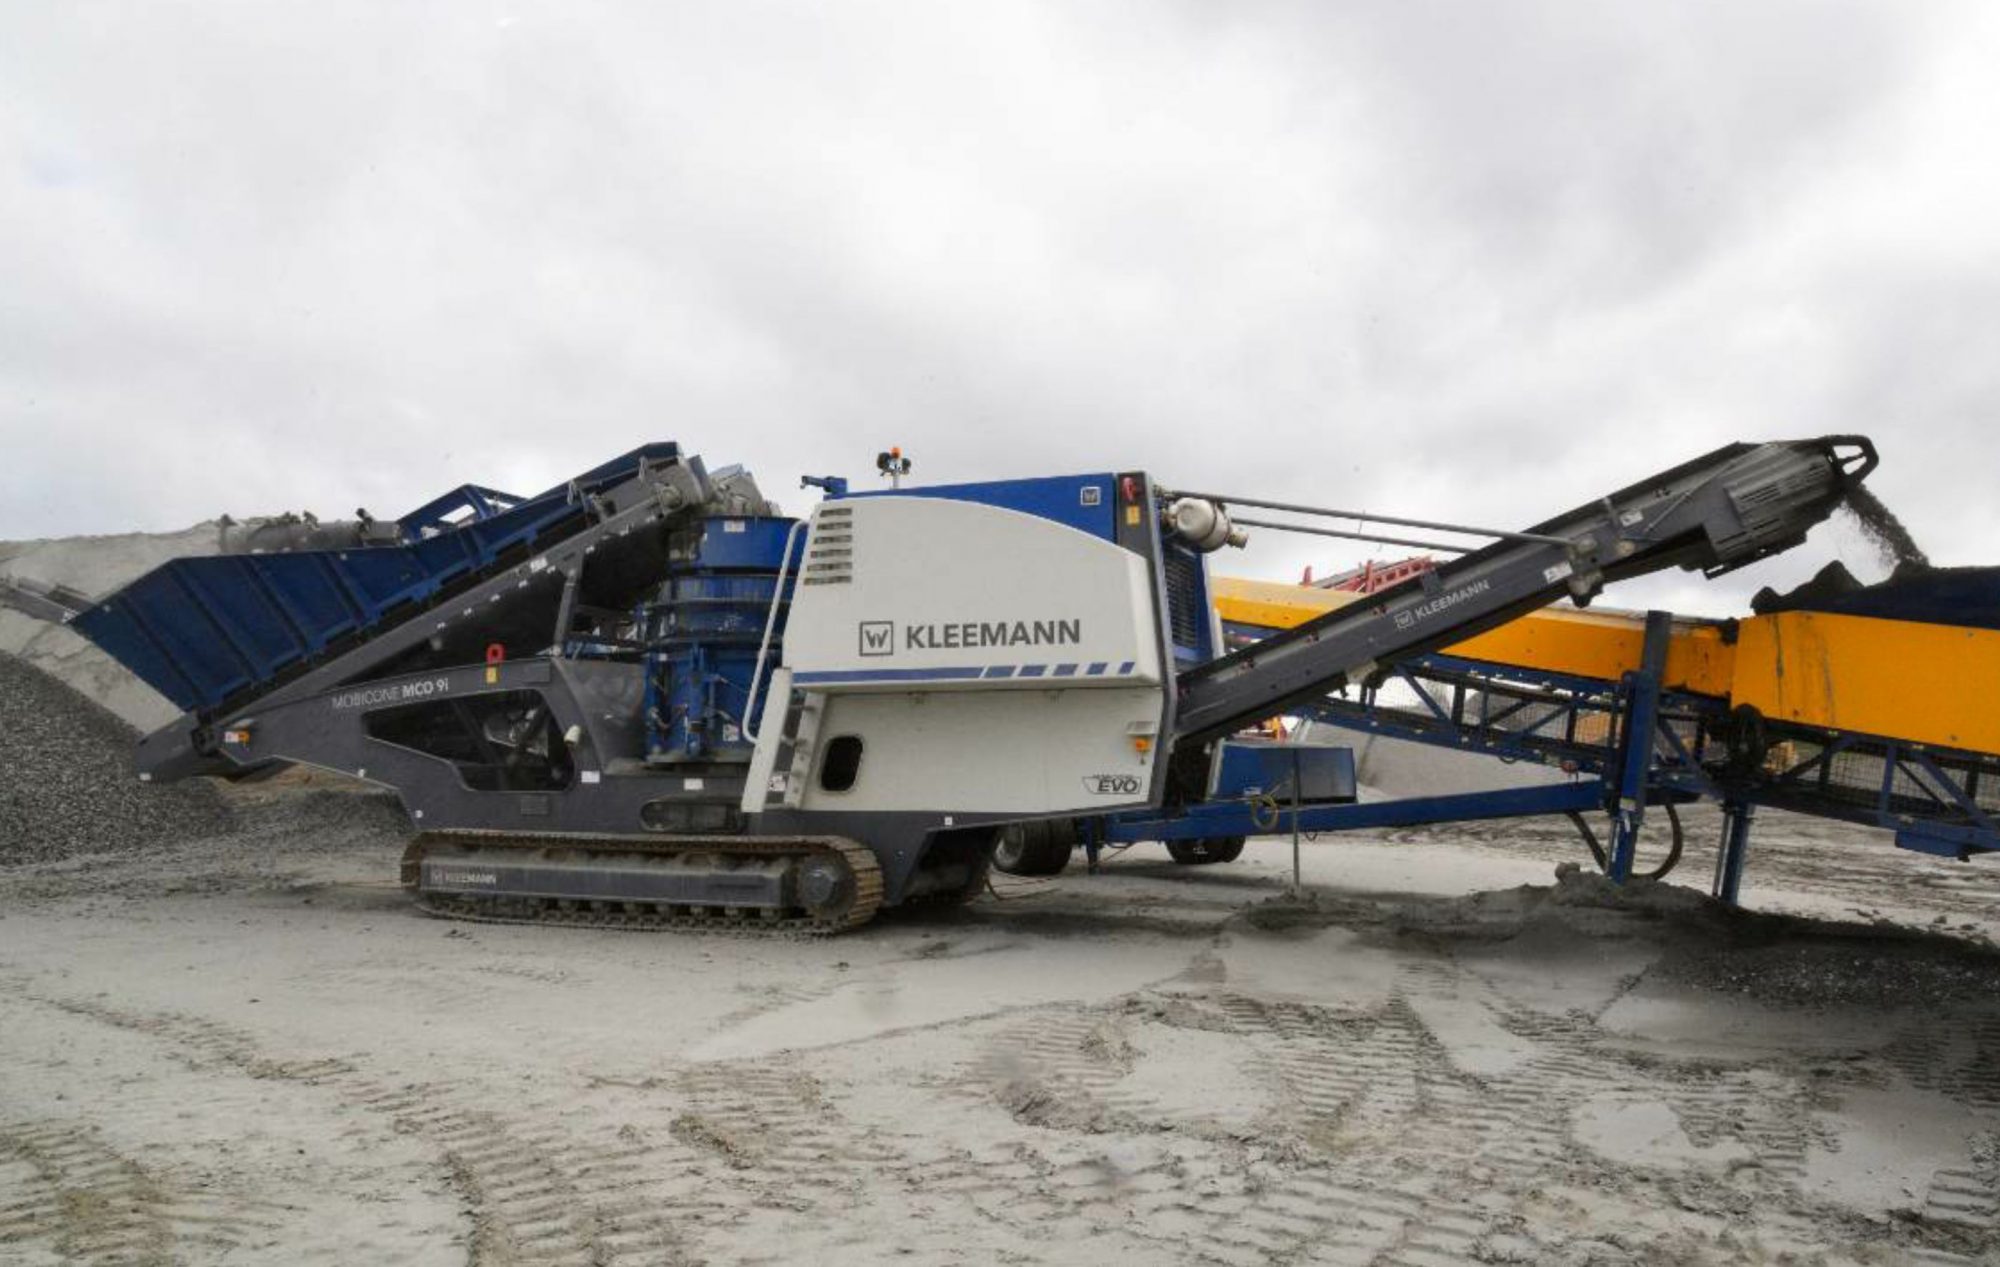
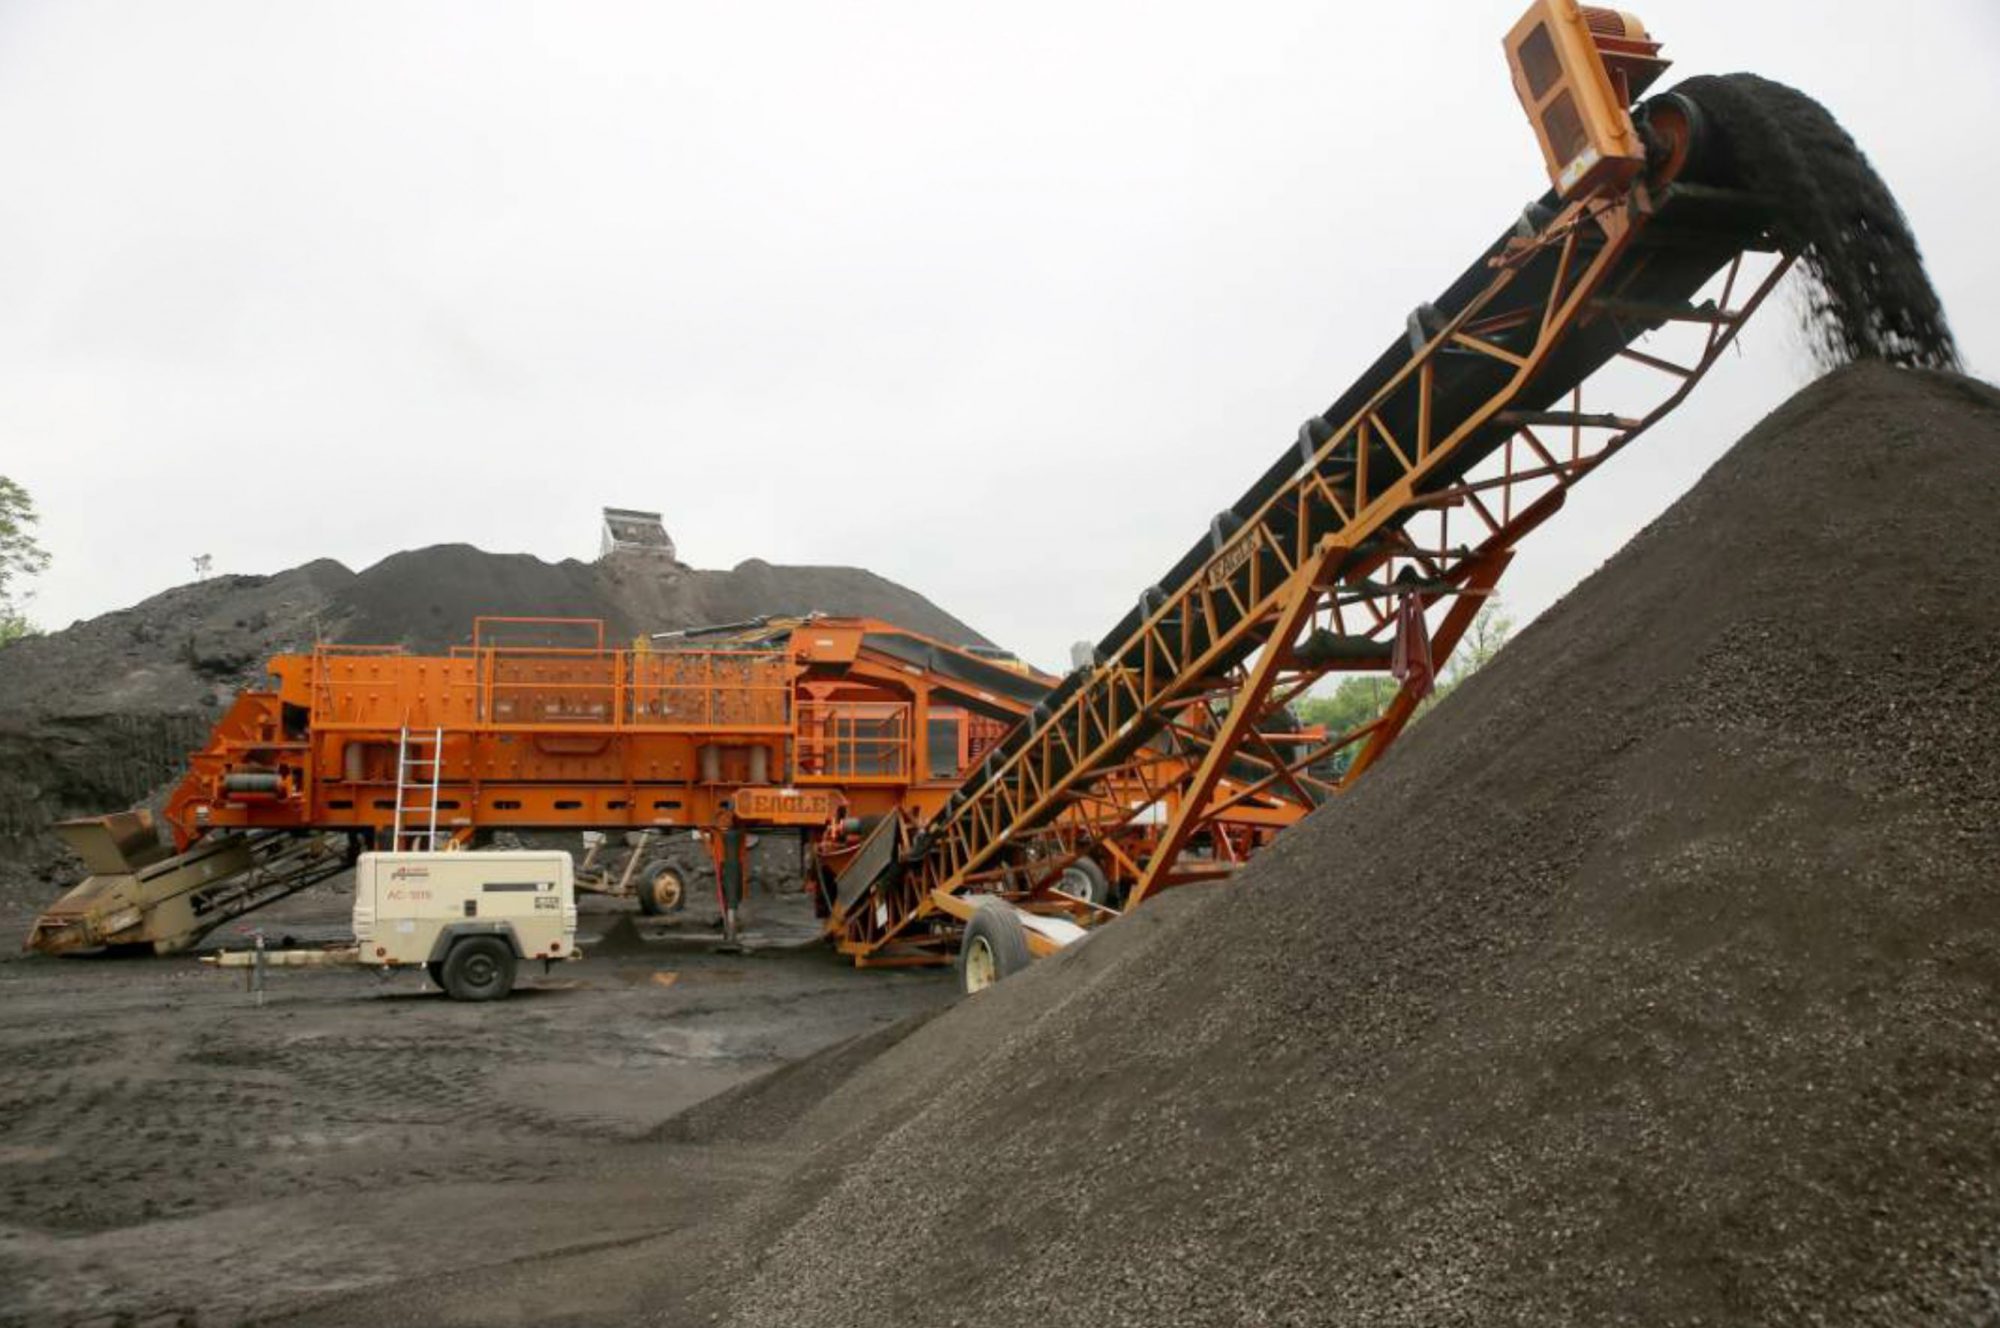
The Pioneer® jaw crusher feeds directly into the K300/6203CC, which combines a Kodiak® Plus K300+ cone crusher with a triple-shaft, low-profile horizontal screen for Big Creek Sand and Gravel’s operation.

“With our old two-deck screening plant, we were limited with the products we could make,” Harvey said. “The three-deck screen allowed us to make a product that is in demand that we were previously wasting.”

The GT205S has also proven to double screening capacity, compared to the company’s old two-deck screening plant, Harvey said.

“Our pit has quite a bit of sand in it, and with the triple-deck screening plant, we get much better screening capacity and can remove a lot more sand than we could with the regular two-deck screen,” he said.

Crush for Cubical Aggregate

As the nation studies higher-performing bituminous mixes and pavements, attention remains focused on the need to optimize the percentage of cubical-shaped aggregate particles in the mix, and limit to low single digits the amount of particles that are flat or elongated.

During crushing and screening, cubical-shaped aggregate particles are created, along with so-called flat or elongated shaped particles, and fines. Since the advent of Superpave mixes in the late 1990s, mix designs have limited the percentage of flat or elongated particles allowed in a mix. That’s because cubical, or angular, and rough-textured aggregates have much greater particle-to-particle contact than rounded and smooth-textured aggregate. The ease of movement of one aggregate particle relative to another is related to the number of contact points between the aggregate particles.

If the aggregates are flat and/or elongated, they can fracture, thus creating a void in the mix. Cubical-shaped products lock together better as a skeleton within the matrix, providing a better-performing mat under compaction, while reducing voids in the mix.

The cubical shape is a better product for both bituminous asphaltic concrete and Portland cement concrete (PCC), as the cubicity suppresses potential voids that might occur, and provides a better finish for both materials.

In fact, elongated pieces in PCC can protrude from the surface of the freshly placed slab, and if your finisher strikes it, he may break or move it, creating a void in the surface. Both the power or hand finisher can strike the elongated particle, pulling it up and out of the surface and creating a void while ruining the finish.

Quite simply, the cubical shape is strong; cubical aggregates lock together, creating a strong pavement, which is why a very high cubical aggregate content appears in virtually every modern standard pavement spec.

Evaluate Cubicity

Cubical Shape

Aggregate characteristics such as particle size, shape and texture influence the performance and rideability of HMA pavements. Crushed or broken surfaces are defined as facets of stone produced by crushing or breaking by natural forces, and are bound by sharp edges.

  • A totally crushed or broken particle is one with more than 90 percent of its surface crushed or broken.
  • A crushed or broken particle has more than 50 percent of its surface crushed or broken.
  • A rounded particle has 50 percent of its surface crushed or broken.
  • A totally rounded particle has more than 90 percent of its surface rounded.

Flat and Elongated Particle Shape

The percentage of crushed and broken surfaces affects interparticle friction, and hence the shear strength of a mix. It also affects friction and surface texture for aggregates used in pavement surfaces.

When trying to optimize a crushing circuit to produce mostly cubical aggregate, it’s important to consider the material being processed and the gradations an operator wants to produce. You have to consider the entire operation in order to achieve one production goal, that of optimized cubical aggregate. You have to start from the very beginning: How you blast material, how raw shot material is conveyed at the plant, what its scalping capability is, and how the equipment delivers material to the primary, secondary, tertiary and even quaternary crushing. Surge control points—such as bins, hoppers and stockpiles—can smooth the flow of material throughout the plant.

Know the composition of your material, understand how it breaks, and then choose the right crushing and screening process needed to produce the finished product in the shape or gradation that your state or application requires. The right type of crushing will optimize creation of a cubical product.

To begin, we are looking for a deposit with minimal clay or deleterious material. Uniformity of feed encourages creation of cubical aggregates and consistency of gradations and shape.

For a feed with deleterious materials a jaw crusher will work without clogging, but jaws tend to produce elongated particles. If you have minimal clay or other deleterious material, a horizontal shaft impact crusher as a primary, and certainly as a secondary, will produce the highest ratios of cubical aggregates.

The type of material plays a big part in how you’re going to process the material. Different rock types favor cubical aggregate production. Chert or flint from a sand and gravel pit will fracture into sharp slivers. On the other hand, cubical shape can be created from granite or limestone or natural gravel or dolomite.

When you get into the slates or cherts or caliche, that kind of material will create more issues with optimizing cubical vs elongated product.
Granite can make a really good cubical shape if you use the right crushers, as well as limestone. When you get into the softer stones, like sandstone, caliche and slate, those can be a little more difficult to make cubical due to their inherent softness.

Jaws vs. Impactors

Crushing in an impact crusher takes place when the stone is struck by the spinning impact bars, and by that stone being flung against an apron. When impact crushing is used, the striking of the aggregate by the spinning rotor’s blow bars knocks off or breaks the elongated fractures. This process is repeated by an impactor in the secondary stage.

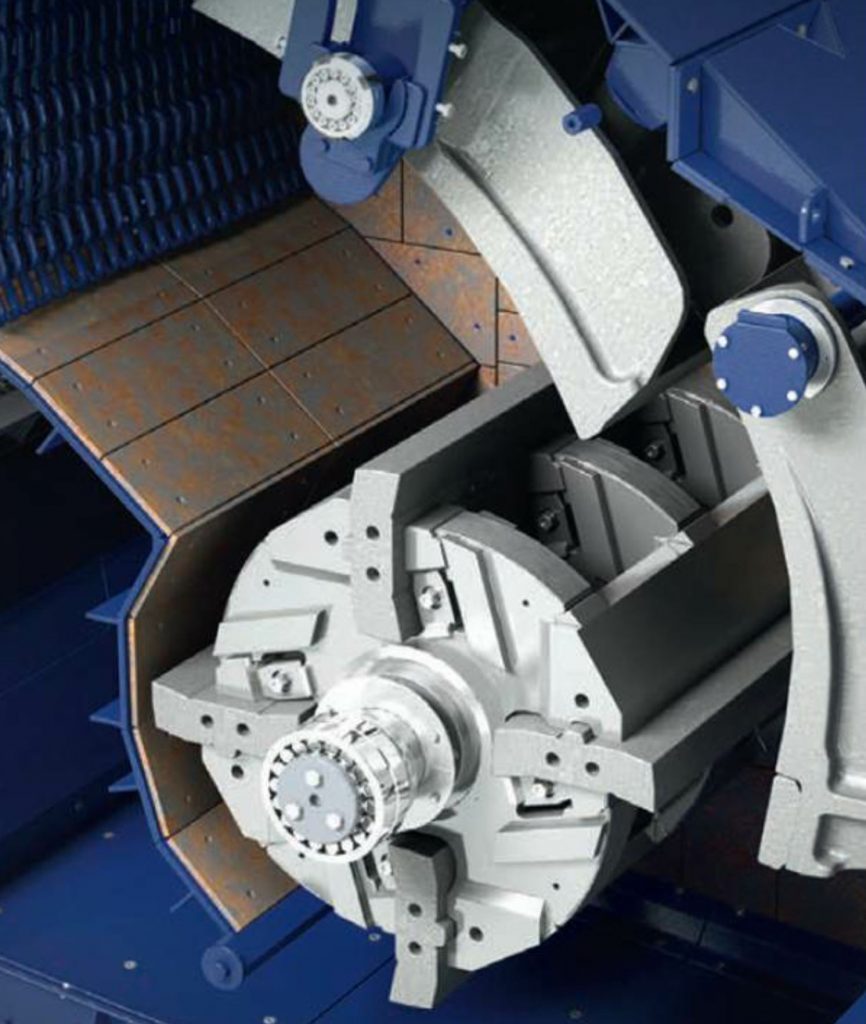
The impactor blow bars break stone and hurl it against aprons (right) for additional breakage.

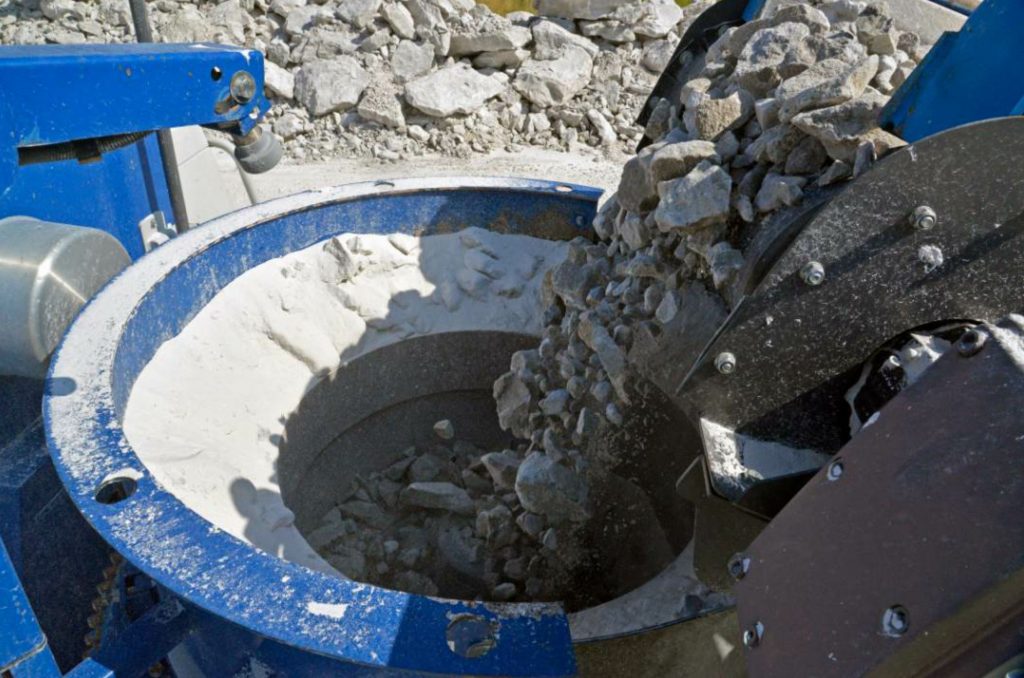
By contrast, with compression crushing via a primary jaw crusher, the material is smashed between two opposing surfaces, resulting in long slivers and more elongated product. That’s why primary impact crushing always will provide a more cubical shape than primary compression crushing with a jaw.

Compression crushing with a higher speed cone crusher is much different. Compression crushing will result in a cubical shape in a cone crusher in a secondary or tertiary application, due to the rock-on-rock compression that takes place within the cone as well as being “choke” fed. With the cones, especially the high-speed cones, material is retained in the crushing chamber longer, allowing rock-on-rock action, which produces a cubical product.

High-speed cone crushers in the secondary position are perfect for cubic aggregate when paired with a primary jaw or impact crusher.

For an abrasive, tough material like an igneous rock, a primary jaw/secondary cone set-up works well, while jaw/impact and impact/cone crusher sets work well for the softer stones. Thus it is possible for cubical product to use a jaw as primary crusher, and then use an impactor or cone as a secondary. Tertiary crushers can be a cone or horizontal shaft impactor (HSI) or vertical shaft impactor (VSI); any one of those three; or a combination of both.

Impact crushers in either primary or secondary position—in particular, HSIs—are ideal for producing a high percentage of cubical aggregates. If you use an impactor as primary, you start the process of having a cubical shape right there, and the cubical proportion is increased as material moves to the secondary or tertiary crushing stages.

Screens Have Limitations

The crushers are the determinant of the percent cubical aggregate processed. The best option is to feed crushed, cubical material to the screen, and let the screen decks size the different particles into the desired cubical gradations. The crusher needs to be the device that controls the amount of elongated product in the feed, not the screen.

Still, choosing the right type of screen media will help control the amount of elongated particles in the product.

Unlike slotted screen media, square mesh screen media will discourage retention of flat or elongated particles in produced aggregate gradations.

For example, any screen with slots in it—allowing material to turn on its side and drop through—will encourage the percent of elongated material produced. Slotted screens may have opening widths of a half-inch wide, but the slots will be 2 to 3 inches long, allowing elongated material to pass through the slot.

Square mesh screen media help keep elongated material out of the mix. Square openings in mesh also will allow elongated particles to pass, but it’s less likely that those elongated pieces will pass through, compared to slotted screen media.

Small as it is, the square opening is square, not elongated. Elongated particles can pass through a square media vertically, but if positioned horizontally, as most are, as the feed flows down the inclined screen, elongates will roll off and either be re-crushed via the return circuit, or go into a different, non-state spec product like base or fill material, but not asphalt or PCC mixes. With base or fill product, elongated material is acceptable.

When material goes to a screen, you are using the screen to size a finished product into individual gradations. Once flat or elongated materials are in the product flow, it’s very difficult to separate elongated material from the cubical material. The best scenario is to make a good cubical product at the crusher, and then allow the screen to size the material out to the proper sizes. Send good cubical material from crusher to the screen and let the screen separate the sizes into the finished gradations.

That means you want to have the right crushers up front to make the cubical shape in the feed before sending it to the screen plant. Have the right type of crusher based on the raw material, and the finished product sizes that are required. Make sure you choose the right type of crushing to minimize elongated material and maximize cubical material.

Kelly Graves is director of sales for North America, Kleemann div. of Wirtgen Group

Best Practices for Crushing, Screening RAP for HMA Production

Asphalt producers know that many factors go into making the highest quality hot-mix asphalt (HMA) end product from reclaimed asphalt pavement (RAP). Important considerations include the need for correct size and shape of material, structural soundness, and a minimum of moisture, fines and white rock going into the mix.

Additionally, production capacity is a key factor in assuring asphalt drum mixers can operate at the sometimes 24/7 demand that is generated in peak asphalt season. A slip in production capacity at the front end leads to disruption in the whole asphalt system. This article will discuss what producers can do to assure crushing and screening of RAP meets best practices for achieving highest product quality and production capacity goals.

There are many choices in crushing and screening equipment to get the job done. When it comes to crushing, jaw crushers, cone crushers and impact crushers all have specific applications. Jaw and cone crushers are popularly used equipment types, but there are key reasons why an impact crusher may be the best choice for achieving the end quality product producers desire, along with providing the necessary production capacity to keep high-quality hot mix flowing.

Crushing and screening RAP is a recycling application, which requires very different end product needs than virgin aggregate and even concrete crushing applications. Jaw and cone crushers are highly effective in crushing hard rock. RAP, however, is not hard rock, and the unique characteristics of RAP crushing can actually cause cone crushers to negatively impact product output.

As cone crushers crush and re-crush the RAP to break it apart, the asphalt can be literally stripped from the RAP, creating white rock, which now requires the extra step and cost of recoating.

A jaw crusher in a RAP circuit is used for primary reduction, prepping it for the cone and requiring at least two crushers, and in some instances, a vertical shaft impactor (VSI) to make a spec product. An impactor in most RAP applications typically requires only one crusher. Two may be necessary where very high capacity or special products are required.

Cone crushers can work fairly well until heat is added into the equation, but as heat and pressure build, the RAP can become a hardened material, so compressed that it can become uncrushable, resulting in what is called “Bonne Float,” almost metal-to-metal compaction. The forces that can be created are directed down through the bearings and can destroy them, requiring extensive and expensive down time.

Impact crushers, on the other hand, use a simpler design comprised of a rotor and two bearings that spin to launch the RAP against a curtain. In my 45 years in the crushing and screening business, 26 of those selling the UltraMax® Impactor for Eagle Crusher Company, I have sold jaws, cones, impactors, hammermills, VSIs, roll crushers, and even Wood Hogs. They all have a specific application in which each one excels. The simplicity of the Eagle Crusher impactor’s three-bar, solid-steel rotor works like this for RAP:


The action of exploding the material with the force of the blow bars and launching it into the primary curtain at the proper angle, then whacking it again with the secondary curtain liners to prepare it for its final reduction, creates a very consistent mix to be sent on to the drum. The RAP impacting into the curtain breaks the interstitial lattice of the RAP’s binding matrix and creates a beneficiation of the original virgin aggregate—simply put, knocking off the arrowheads and cubing up the product. The result is a minimum of white rock and fines produced by the impactor, and a more structurally sound cubical product. Cone crushers tend to “pancake” the RAP and do little to reduce the elongated aggregate, rather than produce the cubical spec product required for highest quality recycling of RAP.

As the impactor separates the binding matrix, the material is aired out and moisture is released, making for a drier material going into the hot mix. Drier material saves energy as it eliminates the need for more gas in the burner.

Why, then, are jaw and cone crushers so popular for RAP? Many producers have grown up in quarries where they have seen, firsthand, the ability of jaw and cone crushers to effectively crush hard rock with wear parts that withstand the crushing process with minimal replacement. This effectiveness and wear-part longevity mindset carries over into the purchase of equipment for recycling of RAP, when recycling RAP is actually a very different application.

In my experience, an impactor works best in RAP with an open setting rather than a closed one. The open setting controls the size and production with speed. With that in mind, an impactor can retain its product gradation as well as capacity throughout its wear life.

Too many times, only the secondary curtain setting is adjusted because it is easier to do than adjusting the primary curtain. However, for best practice, both should be adjusted proportionately to maintain a correct reduction ratio and highest product quality.

When it comes to production capacities of impact crushers compared to jaw and cone crushers for the crushing and screening of RAP, Ryan Freeman, the general manager at Rason Materials, shared his experience.

“Rason operates five asphalt plants and four crushing operations, all on Long Island, New York,” Freeman said. “Working with our Rason company management team, I was able to make the switch from an original configuration of three crushers—a jaw, impactor, and cone with two screen decks, the impactor was not designed for the unique properties of asphalt crushing—to a new configuration of two Eagle Crusher impactors with two screen decks swapped out. We were able to double production capacity based on tons per hour with one less crusher and half the labor.”

Freeman continued, “There’s a lot less skilled labor out there for cone crushers, so finding good cone crusher help is more difficult. Plus, cone crushers are harder to maintain for the products Rason produces.”

One other and often overlooked part of any spec RAP system is the screen. A properly sized and type of screen is critical to any RAP operation. Producers are typically making finer sizes than other types of aggregate and recycling production. For RAP, the screen is the determining factor for net production.

Producers can have all the crushers in the world but if RAP can’t be screened, it probably can’t be used.

Lonesome Prairie Sand & Gravel Solves Too Much Sand

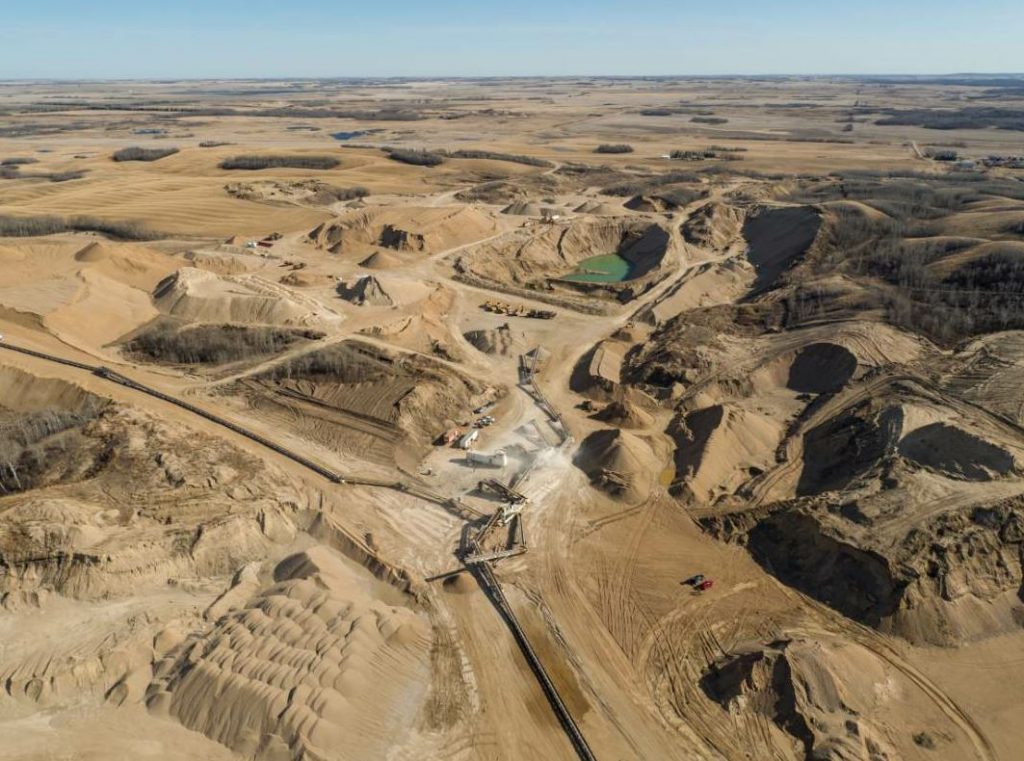
Owners at Lonesome Prairie Sand & Gravel of Canada recognized they had profits buried in millions of tons of sand. The 35-year-old aggregates company found the mountains of sand at its Big Boy Quarry in Wakaw, Saskatchewan—one of five pits it owns—especially troublesome. The quarry is far deeper than most pits—dropping more than 100 feet deep where the average quarry in the region drop 10 to 30 feet. Profits are a challenge because the crews sift through more than a million tons of material every year with only about 200,000 to 300,000 tons of sellable aggregates for concrete and asphalt. The quarry is also located far from large sand-buying markets, thus they are only able to sell about 50,000 tons of sand per year.

Too Much Sand

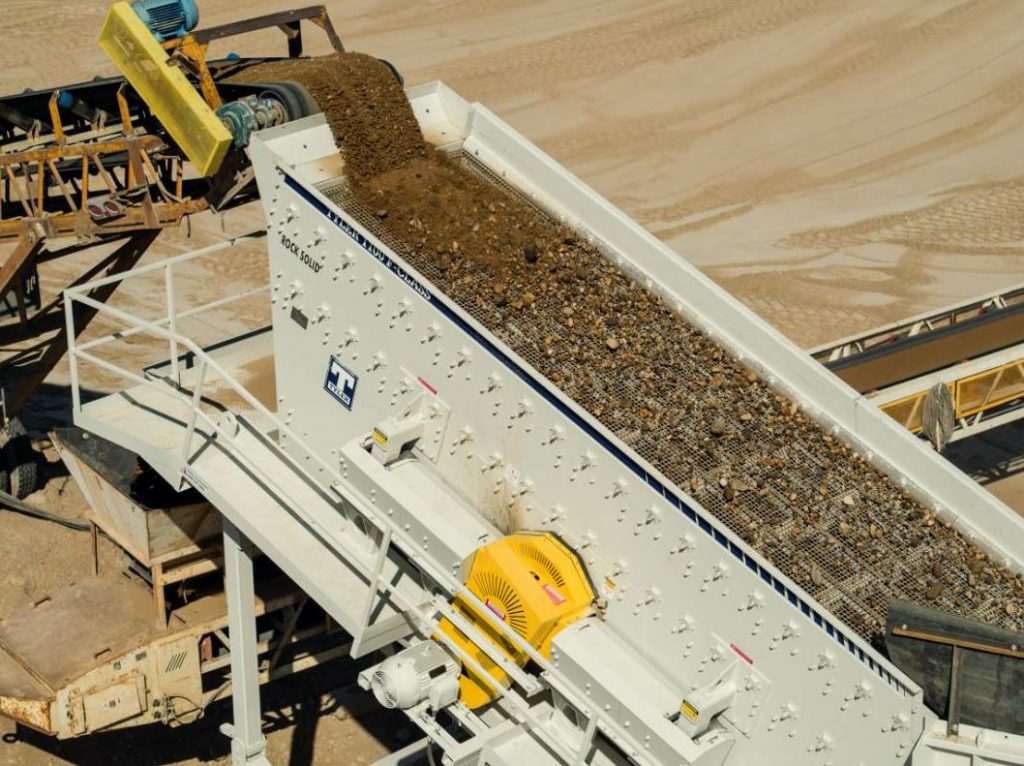
Haver & Boecker’s F-Class vibrating screen features four-bearing technology, which minimizes structural vibrations and delivers a consistent stroke, virtually eliminating surging, blinding, pegging and material contamination.

Haver & Boecker’s F-Class vibrating screen features four-bearing technology, which minimizes structural vibrations and delivers a consistent stroke, virtually eliminating surging, blinding, pegging and material contamination.

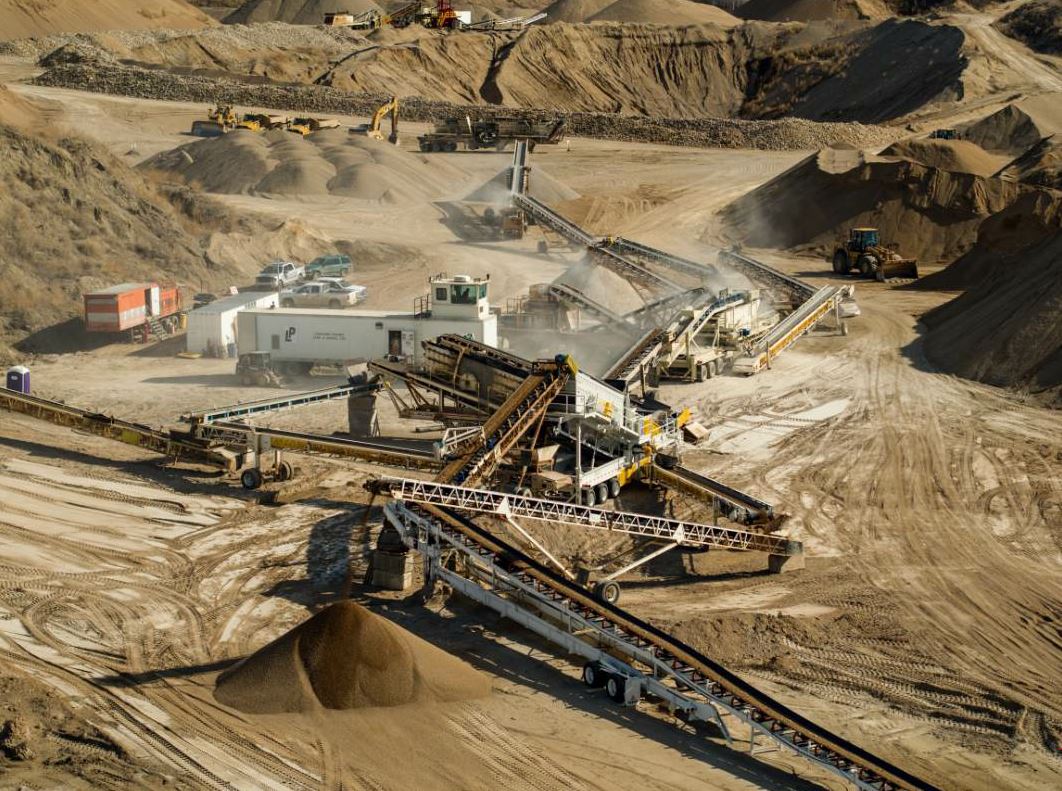
The site is in western Canada, where gravel is becoming harder to find. This means most aggregates operations must use portable equipment to move quickly to the next job. A single Lonesome Prairie crew could operate in as many as 15 to 20 pits per year, spending anywhere from two weeks to two months in a single spot.

Lonesome Prairie had been using two portable vibrating screens in the Wakaw location, but the equipment wasn’t holding up to conditions, causing decreased productivity. The existing machines regularly bogged down, leading to sand going through the crushers and contaminating the sellable material, resulting in wasted product and lost profit. To maximize yields, the operation used screen media with opening sizes as large as 7, 8 and 9 millimeters, and then overloaded the screens with as much as 5,000 tons of material a day. The larger opening sizes meant smaller rock—about 5 to 8 percent of the sellable rock—was falling through with the sand that the operation considers waste material. The issue cost Lonesome Prairie about $200 an hour in production losses.

The larger openings were a quick fix for the material surges as well as blinding problems exacerbated by weather. Regular rain, frost and snow dampen the sand, contributing to material clumping together and blinding screen media.

Production rates and lost revenue were only compounded by increased maintenance costs. The sand caused the vibrating screens to wear quickly and require nearly continuous replacement of screen media. Crews needed to change screen media every two weeks, resulting in two to three hours of downtime and 1,000 to 1,500 tons of lost production for each change-out.

“The many issues were frustrating for our crew and our customers,” said Henry Derksen, Lonesome Prairie Sand & Gravel operations manager.

“Contamination meant our material wasn’t as clean as it should be and we were concerned the issues would drive away our buyers. Production amounts were also not as high as we wanted them to be. We were tired of throwing away rock, so we began looking for a solution.”

You’ve Got to Move it

Big Boy quarry is one of five quarries Lonesome Prairie owns. The 100-foot-deep pit sharply contrasts others in the region that average 10- to 30-foot depths.

Big Boy quarry is one of five quarries Lonesome Prairie owns. The 100-foot-deep pit sharply contrasts others in the region that average 10- to 30-foot depths.

Lonesome Prairie management approached Hikon Industries, an equipment manufacturer and supplier they work with regularly. They talked to several manufacturers, including Haver & Boecker, a company they worked with in the past. They selected the company’s Tyler F-Class vibrating screen, which features a double-eccentric shaft design, supported by four double-spherical roller bearings.

Hikon and Haver & Boecker agreed to work together and started to design a Tyler F-Class portable plant. Hikon custom-built the chassis around the 6- by 20-foot, three-deck F-Class. Haver & Boecker engineers factored in the desired tonnage and the material that Lonesome Prairie processes to determine what the machine’s stroke should be, the speed and general mounting guidelines. Hikon took feedback from the aggregates company, including adding a specially sized jaw crusher on the chassis. Lonesome Prairie also asked that the bottom deck of the vibrating screen be end-tensioned. In the company’s operation, the design results in longer lasting screen media and 30 percent more productivity than side-tensioned machines.

The finished system was inclined to allow for a high production capacity. The machine included a hydraulic system to lift and position the vibrating screen at the optimal angle. The F-Class uses a base frame that attaches to the chassis. Crews use the hydraulic system to set up the portable vibrating screen in less than 30 minutes, with the entire plant—including conveyors and other peripheral equipment—taking about half a day.

The F-Class portable plant arrived at Big Boy Quarry in April 2016, and Lonesome Prairie began testing immediately. They found the single vibrating screen increased aggregates production by about 25 percent, even as rain came and went. The improved screening action allowed the operation to maintain needed production rates while using screen media with an open area of about 4 millimeters, preventing waste of the smaller sellable material the company had lost while using larger open area screens.

“Price can be a problem in western Canada because our competitive market often calls for cheaper equipment that fit the budget. But despite the higher price tag, I have no doubts we’re improving profits with this machine,” Derksen said.

Screen media change-outs went from every two weeks to every six weeks—saving the operation $10,000 a month. Replacement times on the end-tensioned bottom deck, which requires the most change-outs, dropped to half an hour. Replacement times for the top two decks stayed about the same. Derksen said Haver & Boecker technicians helped choose the best screen media combination for his application, which has helped improve wear-life and reduce contamination.

The F-Class portable plant will stay at Big Boy for some time unless they encounter similar sand and productivity problems elsewhere. Looking ahead, given the success Derksen has seen, he anticipates a fast ROI.

Green Asphalt Produces 100 Percent RAP

Michael Capasso is first and foremost a contractor. As such, he tends to think that nothing is impossible.

That can-do attitude is what led him to launch Green Asphalt Co. in Long Island City, New York, in 2011 with one goal in mind: to produce 100 percent RAP asphalt mix with quality equal to or surpassing that of conventional asphalt.

Today, Green Asphalt’s 100 percent RAP asphalt mix is approved for use in New York DOT and New York City Department of Design and Construction projects, and Capasso has a new goal in mind.

“By 2038, our goal is to have all asphalt be 100 percent RAP,” he said. “Eventually, conventional asphalt will be green asphalt.”

Changing Mindsets
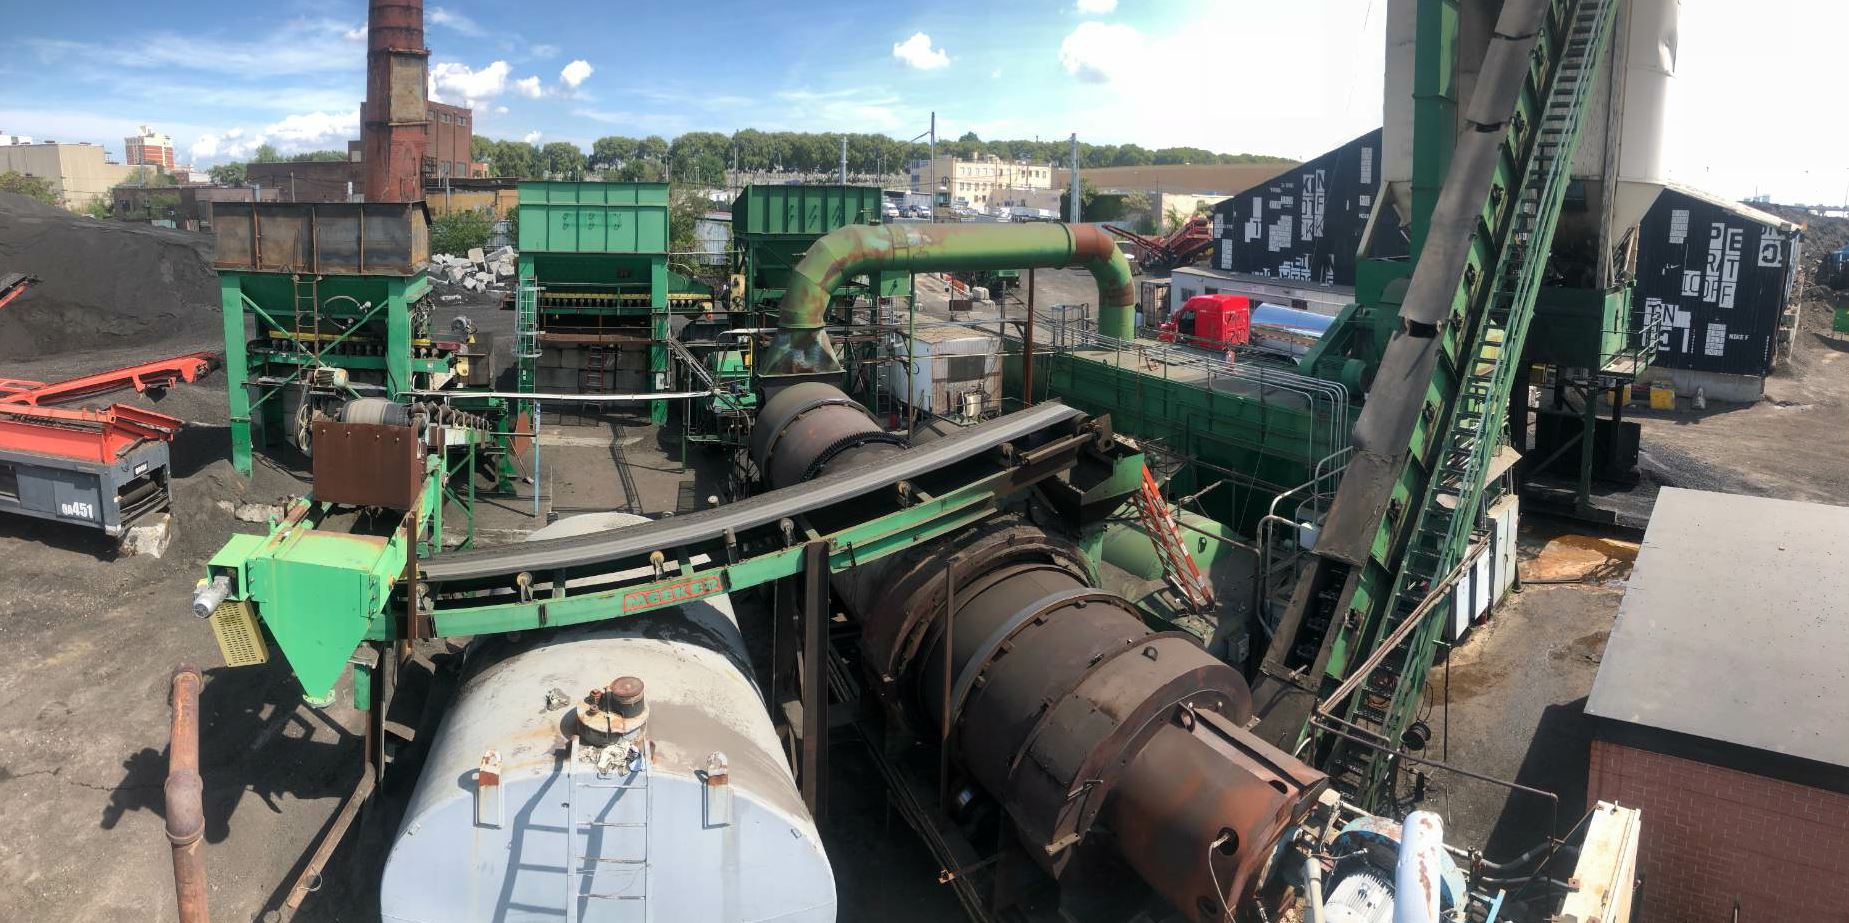
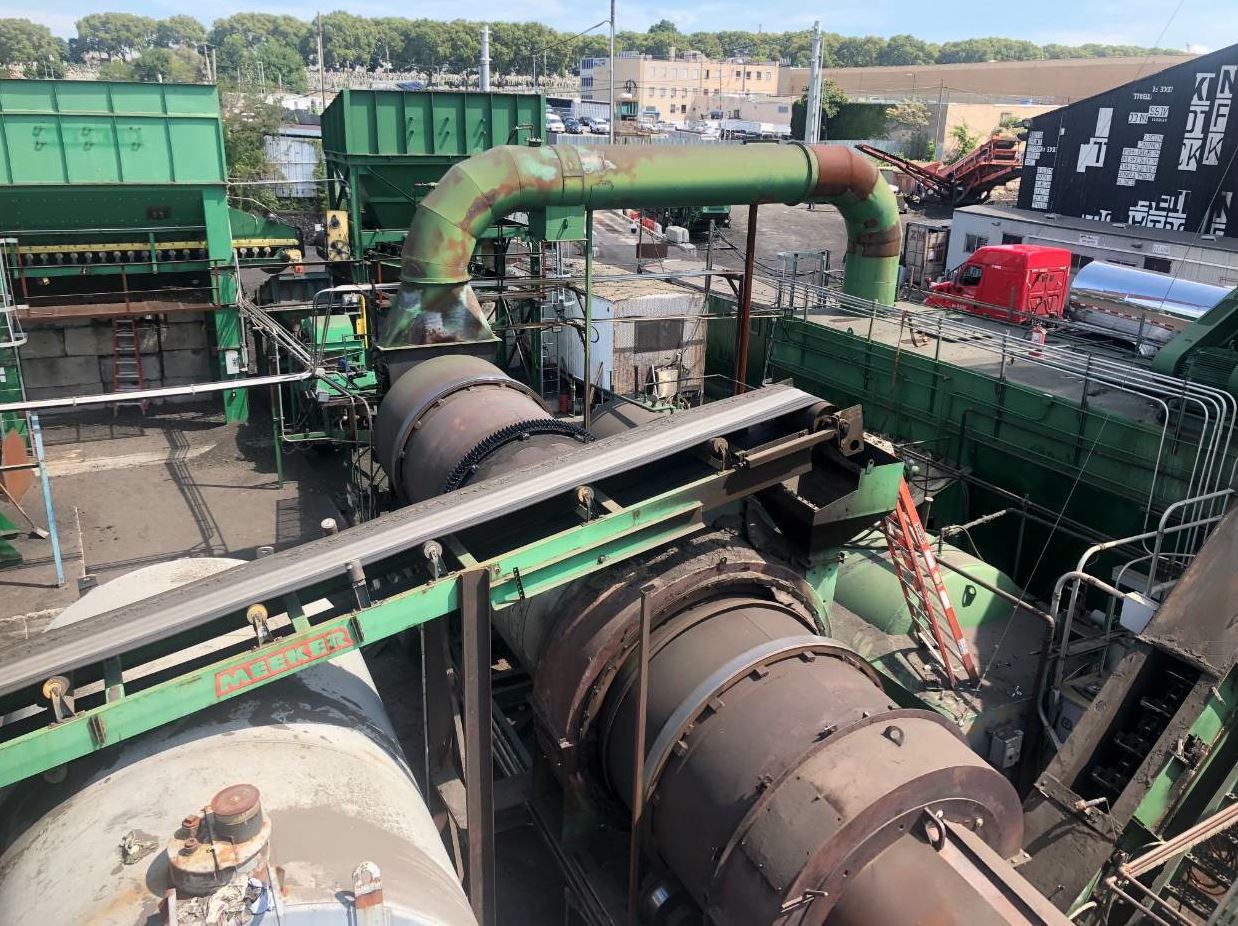
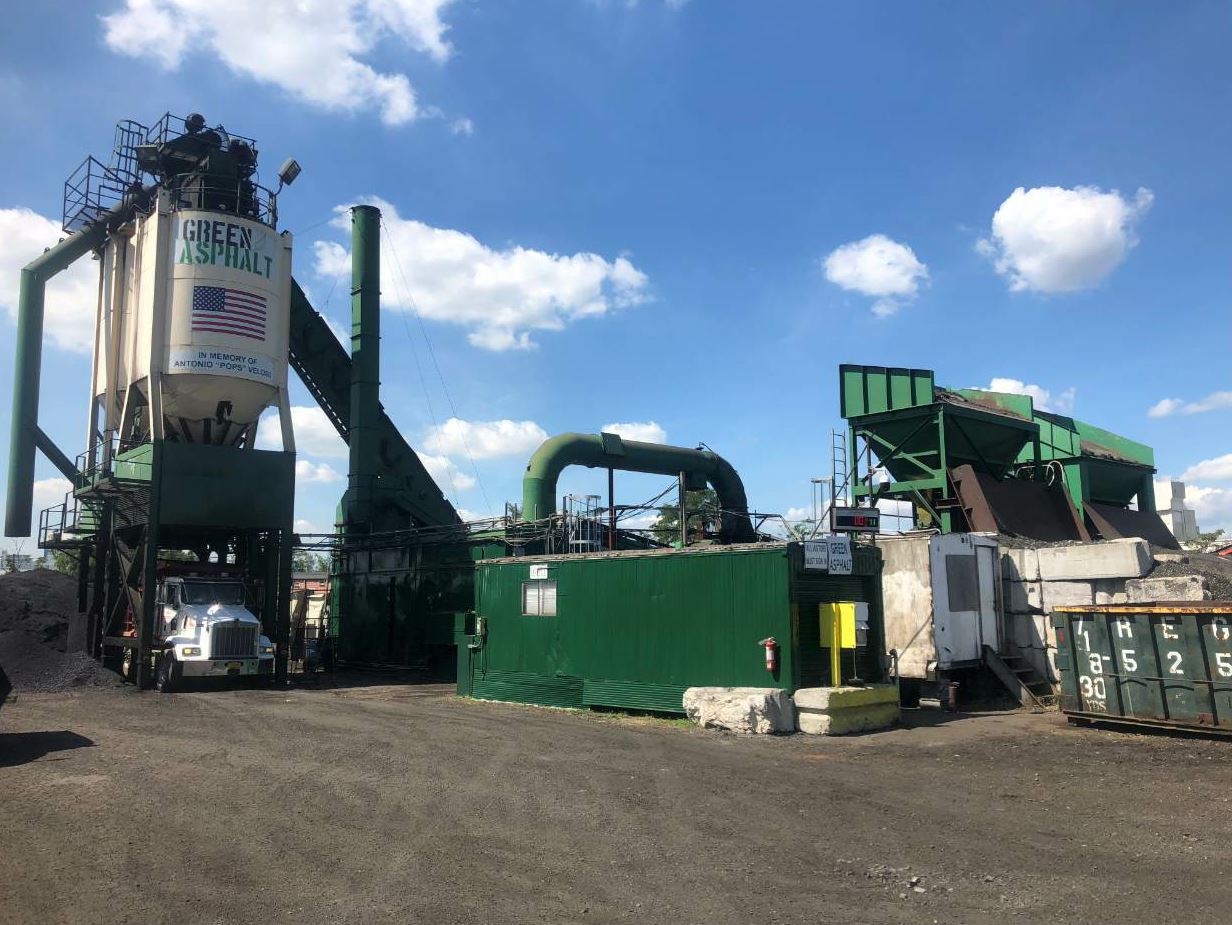
Changes to the plant include ensuring the material isn't exposed to a direct flame, but still heats to an appropriate temperature, experimenting with rejuvenators, and changing the baghouse setup.

Changes to the plant include ensuring the material isn’t exposed to a direct flame, but still heats to an appropriate temperature, experimenting with rejuvenators, and changing the baghouse setup.

Capasso’s motivations for producing 100 percent RAP mix were simple. “The environmental impact was number one,” he said, “but also addressing the issue of excess millings in the city and lowering production costs.”

The process of achieving that lofty goal was a bit more complex. The team at Green Asphalt quickly realized that they’d have to make significant changes to the way asphalt is produced.

“The perception that recycled asphalt means diminished quality is a result of producing recycled asphalt without changing the process of production,” said Nima Roohi Sefidmazgi, Green Asphalt’s vice president and head of business development. “We had to reinvent the wheel to determine what will work for 100 percent RAP.”

For example, asphalt plants have traditionally crushed RAP to one size in the past. That size was usually ½-inch minus, so it could be stored in a single stockpile. “If the quality of the aggregate isn’t very high, that will generate a lot of fines and dust in the crushed RAP, which introduces problems with the dust to binder ratio,” Sefidmazgi said.

Asphalt plants designed to run virgin material, which isn’t coated with AC, don’t have to worry about exposing that material to high temperatures over a direct flame, Sefidmazgi said, because that won’t generate any smoke and it doesn’t damage the material. “When using RAP, the material is already coated in AC, so the general process isn’t an option because it damages the valuable liquid AC coating the aggregates,” Sefidmazgi said. “The process has to be redesigned in a way to handle the high percent RAP.”

Additionally, Sefidmazgi said, it’s common to rely on super-heated virgin aggregate to then heat up the RAP. However, that doesn’t work as efficiently as RAP percentages increase.

“If you go over 30 or 40 percent, you’re relying on a much smaller mass of virgin aggregates to heat that RAP,” Sefidmazgi said. “Secondly, it’s very difficult to melt down that AC to consistently coat the RAP and virgin aggregates.”

“We are changing that mindset,” Sefidmazgi said. “Instead of trying to get 40 or 50 percent RAP with the old process, let’s invent an entirely new process where we can use all of the valuable AC in the mix.”

Changing Processes
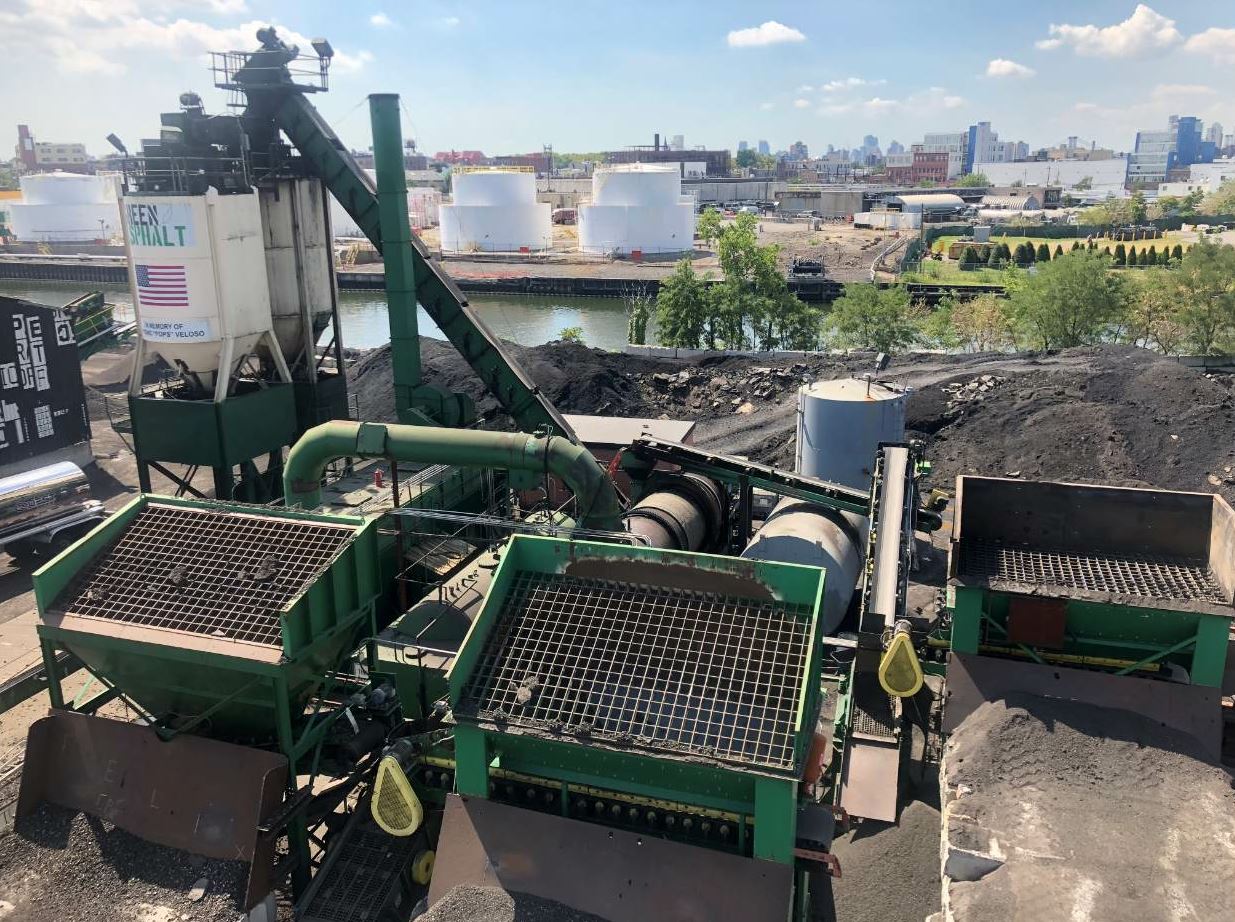
Green Asphalt’s 100 percent RAP asphalt mix is approved for use in New York DOT and New York City Department of Design and Construction projects.

Green Asphalt’s 100 percent RAP asphalt mix is approved for use in New York DOT and New York City Department of Design and Construction projects.

Green Asphalt first reached out to a couple of consultants who’d had experience with high percent recycled asphalt and began putting together a plant in Long Island City.

“The original plant was put together like a puzzle, with each piece coming from a different manufacturer,” Sefidmazgi said. “The plant that we built, you couldn’t buy off the shelf.” Each of the pieces is ‘off the shelf’, however Green Asphalt has changed the general process and plant configuration.

That process included a lot of trial and error, Sefidmazgi said.

They had to experiment with material processing, crushing, screening and stockpiling. They had to experiment with the heating system, temperature, buckets and flights. They had to experiment with handling less airborne particles and more fumes. And that was only the beginning.

“During this research and development state, we’d do things one way and fail, then another way and fail, and finally find success,” Sefidmazgi said. “A lot of what we do had to be invented as we went along.”

For example, Green Asphalt separates its RAP into various sizes, much like fractionating RAP into different stockpile sizes. However, most of the changes were to the burner, mixing and drying system, and the baghouse. The way they heat the RAP is different.

Instead of having a drying zone in which virgin material is superheated and a mixing zone in which it is then mixed with RAP under no direct heat, Green Asphalt heats RAP stone and sand throughout the whole drum at temperatures between 300 and 350 degrees Fahrenheit.

“The RAP gets heated by the hot gas coming from the flame,” Sefidmazgi said. “We pay attention not to let the flame touch the RAP.” To do this, they use refractory tubes and physically change the burner position to prevent the flame from touching the material.

“The last step on the equipment and production side was the development of a new baghouse system,” Sefidmazgi said. When virgin aggregate tumbles around in the drum, it creates airborne particles that must be captured in the baghouse. However, when heating RAP in the drum, the particles aren’t an issue, but fumes are, according to Sefidmazgi. “The filtering system in our baghouse is designed to take those fumes in,” Sefidmazgi said.

Also key to ensure mix quality is adding a rejuvenator. “We had to do a lot of research and experimentation on that to figure out what would work for 100 percent RAP,” Sefidmazgi said. They tried a variety of options and performed cracking and other tests before landing on the rejuvenator they now use.

“Most of what we’ve discovered, we own the intellectual property on,” Sefidmazgi said. “We were very fortunate to have the opportunity to take this risk, and invest the time and money to do this.”

Changing Specifications

Green Asphalt was also fortunate to have its sister company, CAC Industries, to test its 100 percent RAP mixes on its temporary paving jobs and provide feedback on product quality and performance.

CAC is a construction company working on infrastructure in New York City.

As Green Asphalt perfected its mix design, CAC was able to guarantee roads for a certain duration for its agency jobs. “They wanted us to prove it out,” Capasso said. “So if something went wrong, we were responsible for fixing it.”

That was the biggest challenge, Capasso said: convincing state and municipal agencies that a high-quality 100 percent RAP mix was possible.

Green Asphalt performed many test sections and pilot projects before its mix was approved by local and statewide agencies. Although New York state doesn’t allow high RAP mixes on the roads, they do allow it on shoulders, Sefidmazgi said. City agencies, he adds, allow use of 100 percent RAP on any application.

For example, they performed a pilot project on College Point Boulevard in Queens with two sections side by side, one with 30 percent RAP mix and the other with Green Asphalt’s 100 percent RAP mix. Six months after the job’s construction, Green Asphalt took cores and ran Hamburg and semi-circular bend (SCB) tests.

“Mixes showed satisfactory results using these tests,” Sefidmazgi said. “At the time, since there was no I-FIT test for SCB, we used Louisiana DOT’s method and criteria.”

“The proof is in the pudding,” Capasso said. “We’ve put our mix down all over the place and we’ve tested it in labs and on the streets. We’ve watched the wear and tear, we’ve done side-by-side road strips, and we don’t see any difference.”
In 2015, four years after the company was founded, it got approval for its mixes from New York DOT and New York City Department of Design and Construction.

“The majority of production in New York City is designed with the Marshall Method rather than Superpave, so we really had to work with agencies to look at performance-based mix design versus volumetrics,” Sefidmazgi said. “The state had to think about the process of approving a plant like ours.”

In the end, it was determined different enough to get a unique plant code, R0001, whereas other asphalt plant codes are typically an H followed by a five-digit number.

“The bottom line is you can design 100 percent RAP for any type of performance you want if you produce it the right way,” Sefidmazgi said. “The perception is that recycled material is low quality and leads to premature failures, but we’re making the industry understand that doesn’t have to be the case.”

Changing Materials
The team at Green Asphalt realized that they’d have to make significant changes to the way asphalt is produced to achieve their goal of producing asphalt with 100 percent RAP.

The team at Green Asphalt realized that they’d have to make significant changes to the way asphalt is produced to achieve their goal of producing asphalt with 100 percent RAP.

Green Asphalt doesn’t have any virgin material in its operation.

“When you think about it, when you’re running 100 percent RAP plant, you’re really running an aggregate quarry and asphalt plant all in one because you’re making your raw materials that you’re using for production,” Sefidmazgi said. “Most places are making 30 percent or below RAP mixes, so that means if you mill up 100,000 tons of asphalt, only 30,000 is going back into your mix and 70,000 tons is going into a pile.”

“We’ve kicked the stockpiling issue in urban areas down the road and we need to deal with that,” Capasso said. And deal with it they did. In addition to alleviating the issue of stockpiles in New York City, Green Asphalt’s 100 percent RAP approach has also become a revenue stream.

In fact, Green Asphalt has a contract with New York City’s DOT to receive their millings.

“I know plants in less densely populated areas pay for millings, but here it’s the other way around,” Sefidmazgi said. “They pay us per ton of material. That’s really the case in a lot of urban areas because there’s nowhere to put those millings. It’s not valuable to put a pile of asphalt on the real estate here when you could do something more lucrative.”

According to Sefidmazgi, Green Asphalt accepts material for around half the cost of alternative options.

Sefidmazgi estimates that the DOT contract brings them around 85,000 tons each year. The remaining tonnage comes from Green Asphalt’s contractor customers.

“In the future,” Sefidmazgi said, “we will need to go back to our old roads as our quarries and refineries, and use that to make our new roads.” Green Asphalt, he added, is preparing for that not-too-distant tomorrow today.

Changing the World

Today, Green Asphalt has 15 employees and produces between 100,000 to 150,000 tons of mix per year, which is maximum capacity for their mix-and-match plant.

Today, between 70 and 80 percent of Green Asphalt’s mix is for public work, the rest, private. Prior to its approval in 2015, Sefidmazgi estimates that 90 percent of its production was private and the 10 percent that was public was exclusively test sections. And CAC continues to be Green Asphalt’s biggest customer, purchasing between 20 and 30 percent of its mix.

The next step in Green Asphalt’s master plan is to license its technology to convert existing plants to 100 percent RAP plants, Capasso said.
“The point we’re at right now is we’ve perfected our model in New York City and we’re going around the country to license this technology to other producers in metro areas: Boston, Chicago, LA, Seattle, Dallas,” Sefidmazgi said. That process also involves working with agencies to put in place quality control/quality assurance (QC/QA) processes they can trust to ensure that these products can be used on those agency jobs.

Sefidmazgi estimates that, depending on the type of plant, the cost to retrofit an existing plant to producing 100 percent RAP ranges from $750,0000 to $1.5 million.

“As fuel prices rise, the value proposition becomes much greater for what we’re doing,” Capasso said. “There’s this idea that if it isn’t broke, don’t fix it. People have been making money in our industry doing things one way for generations. There needs to be a willingness to change.”

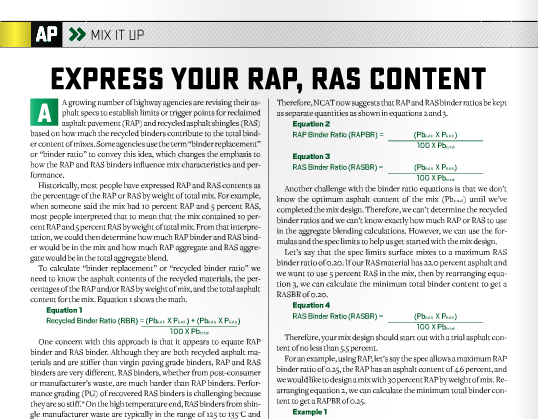
Express Your RAP, RAS Content

A growing number of highway agencies are revising their asphalt specs to establish limits or trigger points for reclaimed asphalt pavement (RAP) and recycled asphalt shingles (RAS) based on how much the recycled binders contribute to the total binder content of mixes. Some agencies use the term “binder replacement” or “binder ratio” to convey this idea, which changes the emphasis to how the RAP and RAS binders influence mix characteristics and performance.

Historically, most people have expressed RAP and RAS contents as the percentage of the RAP or RAS by weight of total mix. For example, when someone said the mix had 10 percent RAP and 5 percent RAS, most people interpreted that to mean that the mix contained 10 percent RAP and 5 percent RAS by weight of total mix. From that interpretation, we could then determine how much RAP binder and RAS binder would be in the mix and how much RAP aggregate and RAS aggregate would be in the total aggregate blend.

To calculate “binder replacement” or “recycled binder ratio” we need to know the asphalt contents of the recycled materials, the percentages of the RAP and/or RAS by weight of mix, and the total asphalt content for the mix. Equation 1 shows the math.
Inset1

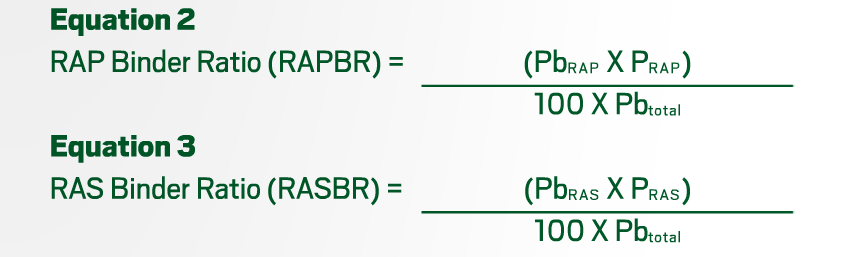
One concern with this approach is that it appears to equate RAP binder and RAS binder. Although they are both recycled asphalt materials and are stiffer than virgin paving grade binders, RAP and RAS binders are very different. RAS binders, whether from post-consumer or manufacturer’s waste, are much harder than RAP binders. Performance grading (PG) of recovered RAS binders is challenging because they are so stiff.* On the high temperature end, RAS binders from shingle manufacturer waste are typically in the range of 125 to 135oC and post-consumer RAS binders typically grade at 150 to 170oC. RAP binders typically grade in the range of 85 to 95oC on the high temperature end and -20 and -5oC on the low end.  Making and testing bending beam rheometer (BBR) specimens with RAS binders is extremely challenging, so low temperature grading of pure RAS binders is questionable. Therefore, NCAT now suggests that RAP and RAS binder ratios be kept as separate quantities as shown in equations 2 and 3.
Screen Shot 2016-01-19 at 9.13.16 PM

Another challenge with the binder ratio equations is that we don’t know the optimum asphalt content of the mix (Pbtotal) until we’ve completed the mix design. Therefore, we can’t determine the recycled binder ratios and we can’t know exactly how much RAP or RAS to use in the aggregate blending calculations. However, we can use the formulas and the spec limits to help us get started with the mix design.

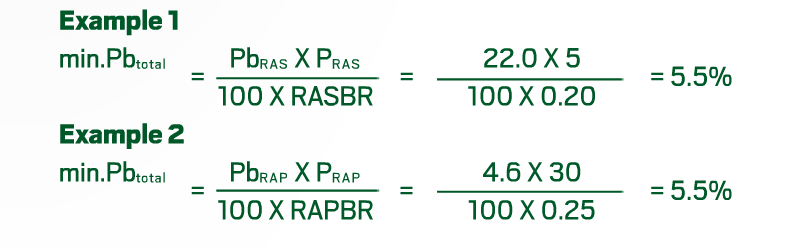
Let’s say that the spec limits surface mixes to a maximum RAS binder ratio of 0.20. If our RAS material has 22.0 percent asphalt and we want to use 5 percent RAS in the mix, then by rearranging equation 3, we can calculate the minimum total binder content to get a RASBR of 0.20.

Screen Shot 2016-01-19 at 9.13.28 PM
Therefore, your mix design should start out with a trial asphalt content of no less than 5.5 percent.

For an example, using RAP, let’s say the spec allows a maximum RAP binder ratio of 0.25, the RAP has an asphalt content of 4.6 percent, and we would like to design a mix with 30 percent RAP by weight of mix. Rearranging equation 2, we can calculate the minimum total binder content to get a RAPBR of 0.25.

Screen Shot 2016-01-19 at 9.13.36 PM
For either of these examples, if the trial mix design samples with 5.5 percent asphalt have air voids below 4.0 percent (or the mix design target air void content), then another aggregate blend or a lower RAP or RAS content will have to be tried.

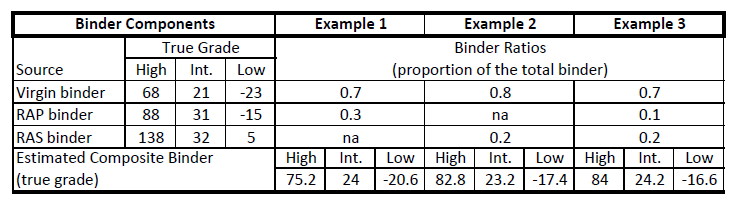
Another benefit of calculating RAP and RAS binder ratios separately is for estimating the properties of the composite binder when recycled binders are combined with a virgin binder. In the past, we used blending charts to estimate the combined properties of RAP and virgin binders. In effect, blending charts simply determine the weighted average of the properties of the two binders being blended. Unfortunately, blending charts are not helpful when more than two binders are combined. However, a weighted average can be easily calculated for any number of components. Table 1 shows the estimated true grade of composite binders for three example combinations of recycled and virgin binders. This approach, like blending charts, assumes complete blending of the component binders, which may not be the case.

For mix designs, we also need to determine how much the RAP and/or RAS contribute to the total aggregate blend. For RAP-only mixes, “by weight of mix” and “by weight of total aggregate” differ little when the asphalt content of the RAP and the mix are similar. However, for mixes containing RAS, the difference between “by weight of mix” and “by weight of total aggregate” is more significant.

First, let’s consider a mix with 20 percent RAP by weight of total mix. The asphalt content of the RAP is 5.1 percent and the asphalt content of the mix design is 5.6 percent. The percentage of total aggregate by weight of total mix is…

100-Pbtotal = 100-5.6 = 94.4%

Therefore, the percentage of RAP aggregate by weight of total blend is…

19.0%/94.4% = 0.201 or 20.1%

So saying “20 percent RAP by weight of mix” is almost the same as “20 percent RAP aggregate by weight of total aggregate.”

Now let’s consider an example with RAS. Let’s say the mix contains 5 percent RAS by weight of total mix. The asphalt content of the RAS is 21.3 percent and the asphalt content of the mix design is 5.6 percent. The fiber content of the RAS was determined to be 1.2 percent by weight of total RAS. The percentage of total aggregate by weight of total mix is…
100-Pbtotal = 100-5.6 = 94.4%

The percentage of RAS aggregate by weight of total mix is…
[PRAS X(100-(PbRAS+PfRAS))]/100 = [5.0 X(100-(21.3+1.2))]/100 = 3.9%

…where PfRAS is the fiber content of the RAS. Although the literature on shingles indicates that the fiber content of RAS may range from 2 to 15 percent, NCAT test results on RAS from various sources in the United States have found the fiber contents to range from 1 to 4 percent. Therefore, the percentage of RAS aggregate in the total aggregate blend is…

3.9%/94.4% = 0.042 or 4.2%

NCAT began using a shorthand notation for expressing RAP and RAS contents in asphalt paving mixes in 2014. Because we want to express both RAP and RAS contents as percentages of total mix and their contributions to the total binder content, NCAT offers the following notation:

A/B I D/E where:
A = RAP content as a percentage of total mix (%)
B = RAS content as a percentage of total mix (%)
C = RAP binder ratio (decimal)
D = RAS binder ratio (decimal)

For example, 20/5 I .18/.19 indicates that the mix contains 20 percent RAP and 5 percent RAS by weight of mix, respectively, and the RAP and RAS binder ratios are 0.18 and 0.19, respectively.

Table 1. Example of Calculating Weighted Average Composite Properties for Different RAP and RAS Binder Ratios Source: NCAT’s Asphalt Technology E-News

Table 1. Example of Calculating Weighted Average Composite Properties for Different RAP and RAS Binder Ratios
Source: NCAT’s Asphalt Technology E-News

*See the January 2016 AsphaltPro for articles regarding options for softening and rejuvenating recycled material binders.

Article reprinted from NCAT’s Asphalt Technology E-News, Vol. 26, No. 2